
 Print
Print facebook
 twitter
 Linkedin
 google+

Introduction
Testicular torsion occurs when the spermatic cord becomes abnormally twisted, leading to a partial or complete interruption of blood flow to the testes. This condition is a surgical emergency and most commonly occurs in adolescents. The severity of testicular torsion largely depends on the extent and duration of the torsion [1]. Optimal outcomes are achieved when treatment is administered within a 6-hour window. Success rates for testicular salvage decrease sharply with time: nearly 100% if treated within 6 hours, 70% if treated in 6 to 12 hours, and 20% if treatment occurs between 12 and 24 hours after onset [2,3]. Thus, early diagnosis of acute testicular torsion is crucial for prompt intervention and the preservation of the affected testes.
Currently, conventional ultrasonography (US), which includes grayscale and color Doppler US, is the preferred imaging method for the diagnosis of suspected testicular torsion [3-5]. A 2019 meta-analysis revealed that conventional US exhibited a sensitivity of 95% and a specificity of 98% in identifying testicular torsion [6]. However, in the early stages of torsion, certain internal testicular veins may dilate, increasing blood flow to the testicular parenchyma and potentially contributing to a missed diagnosis [7]. Furthermore, color Doppler flow imaging (CDFI) presents limitations in detecting slow blood flow within the testes of adolescents, increasing the risk of misdiagnosis [5].
Elastography, first described by Ophir et al. [8] for its potential in the non-invasive assessment of tissue mechanical properties, has seen rapid advancements in recent years. Shear wave elastography (SWE), a technique within this field, measures shear wave velocity (SWV) as an indicator of tissue stiffness [9]. SWE has been extensively used to evaluate liver fibrosis, breast tumors, and thyroid nodules [10-13]. However, few studies have been conducted on its application in testicular torsion [14-16]. In cases of complete torsion, significant increases in Young’s modulus have been noted in both the central and peripheral areas of the torsed testes compared to unaffected testes [14]. Xue et al. [15] identified the presence of the "stiff ring sign" in the testes and the "stiff knot sign" in the spermatic cord as characteristic findings of SWE that can aid in differentiating between testicular torsion and acute orchitis, providing valuable clinical insights. Additionally, research by Zhang et al. [16] on rabbits highlighted the potential of SWE in assessing testicular spermatogenesis following torsion. Nevertheless, it remains unclear whether changes in the stiffness of torsed testes occur in tandem with the progression of the condition, as well as how these changes vary across stages of the disease. The objective of this study was to investigate alterations in testicular stiffness at various intervals after torsion by employing serial US of the twisted testes, in conjunction with histopathological analysis, upon establishing an acute testicular torsion model. Furthermore, the study sought to determine the predictive value of testicular stiffness for spermatogenesis following torsion.
Materials and Methods
Compliance with Ethical Standards
All experimental protocols involving animals received approval from the Research Ethics Committee of the relevant institution. These procedures were conducted in adherence to the guidelines set forth in the National Institutes of Health Guide for the Care and Use of Laboratory Animals.
Animals and Experimental Groups
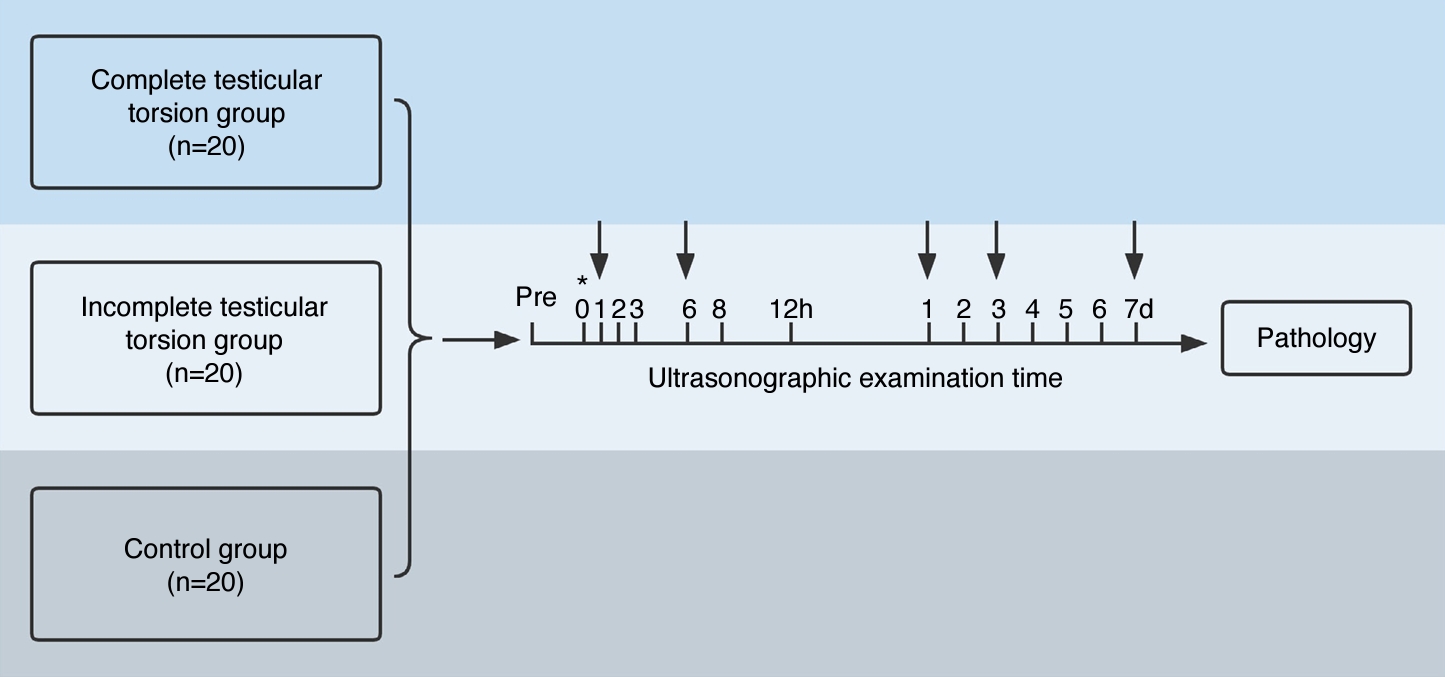
Healthy male New Zealand white rabbits, 5-6 months old and weighing 2.50±0.19 kg, were purchased from the laboratory animal center of Guangdong Province (serial number SCXK-2019-0035). This prospective study, conducted from September 2020 to April 2021, included 60 rabbits. One rabbit was excluded due to the restoration of testicular blood flow after the induction of complete testicular torsion, as shown in Supplementary Fig. 1. The remaining rabbits were randomly assigned to one of three groups: complete testicular torsion, incomplete testicular torsion, or control (n=20 for each).
Testicular Torsion Model
Previous research from the present authors, involving four rabbit models of testicular torsion, indicated that torsion of the outer spermatic cord fascia yielded the most representative model, displaying the most characteristic clinical symptoms [17]. All surgical interventions were conducted with the rabbits under anesthesia, which was induced via an injection of 3% pentobarbital sodium (30 mg/kg) administered into the marginal ear vein.
For the rabbits assigned to the complete or incomplete torsion groups (both n=20), the procedure was randomly performed on one testicle through a lateral scrotal incision. To induce testicular torsion, the testicle was brought through the incision and rotated 540° toward the midline for complete torsion or 360° for incomplete torsion. Subsequently, the twisted testicle was secured to the lateral scrotal wall using a 4-0 polyglactin suture. CDFI was utilized during the operation to assess blood flow within the testicle. The absence of a blood flow signal indicated a complete testicular torsion model, whereas a reduced blood flow signal denoted incomplete testicular torsion. Immediately following the procedure, all rabbits underwent contrast-enhanced ultrasound (CEUS) to assess the torsion.
Control rabbits (n=20) underwent sham surgery on one randomly selected testicle via a lateral scrotal incision. In the immediate postoperative period, all control rabbits were examined using CDFI and CEUS.
Ultrasonographic Examination
Animals were placed in the supine position for evaluation using scrotal US. An Acuson S2000 HELX ultrasound system (Siemens, Erlanger, Germany) equipped with a 4-9 MHz linear transducer was employed to capture images using conventional US, which includes grayscale US and CDFI, as well as SWE. Each rabbit underwent scrotal US preoperatively and then postoperatively at the following time points: immediately, 1 hour, 2 hours, 3 hours, 6 hours, 8 hours, 12 hours, 1 day, 2 days, 3 days, 4 days, 5 days, 6 days, and 7 days (Fig. 1). For SWV, three successive measurements were obtained in the central and peripheral zones of the testicular parenchyma, as seen on the largest standard transverse axis view. These measurements were taken within an elasticity range of 0 to 5 m/s. A measurement sampling box with dimensions of 1×1 mm was used to determine elasticity values. The specific locations for the sampling box were as follows: (1) the central zone of the testicular parenchyma, situated halfway between the rete testis and the testicular capsule; and (2) the peripheral zone of the testicular parenchyma, adjacent to the testicular capsule and at the same level as the central zone.
A trained sonographer with 2 years of experience performed all ultrasound examinations. All SWV values were documented. The ultrasound images were analyzed by two experienced sonographers with 10 years of experience, who reached a consensus. Notably, each reported SWV value represents the mean of three separate measurements taken at each location.
Histologic Analyses
Two rabbits from each experimental group were randomly selected and sacrificed at 1 hour, 6 hours, 1 day, and 3 days postoperatively. At the experimental endpoint, the remaining 12 rabbits from each group were also euthanized (Fig. 1), and their testicular tissues were harvested for histological analysis. All specimens were independently evaluated by a pathologist with 20 years of experience in interpreting testicular pathology, who was blinded to the animal group assignments. The spermatogenic function of the testes was assessed using the Johnsen scoring system (Supplementary Table 1) [16,18]. In this study, histological changes were categorized as normal testicular spermatogenesis, hypospermatogenesis, spermatogenic arrest, Sertoli cell-only syndrome, or the absence of seminiferous tubules [19].
Statistical Analysis
Statistical analyses were performed using SPSS version 25.0 (IBM Corp., Armonk, NY, USA). Continuous variables were expressed as the mean±standard deviation or the median with interquartile range, as appropriate. Categorical variables were reported as numbers and percentages. For continuous parameters, the normality of distribution was assessed using the Shapiro-Wilk test, and values were compared using one-way analysis of variance. The Pearson chi-square test was utilized for categorical variables. Changes in SWV values were analyzed and compared using repeated-measures analysis of variance. Additionally, linear correlation and receiver operating characteristic (ROC) analyses were conducted using Prism 8 (GraphPad Software, San Diego, CA, USA). To evaluate the relationship between SWV values in the central and peripheral zones of the largest standard transverse axis view of the testicular parenchyma and spermatogenic function, Spearman rank correlation coefficients were employed. Areas under the ROC curves (AUCs) were calculated to assess the diagnostic performance of SWE in determining the degree of spermatogenic function impairment. The DeLong test was applied to compare the AUC figures. P-values of less than 0.05 were considered to indicate statistical significance.
Results
Characteristics of Experimental Animals
A total of 60 healthy male rabbits, 5-6 months old and weighing 2.50±0.19 kg, were included in the analysis. These rabbits were randomly assigned to one of three groups: complete testicular torsion, incomplete testicular torsion, or control (n=20 for each). The baseline characteristics of the animals are detailed in Table 1.
Imaging and Pathology of Control Animals
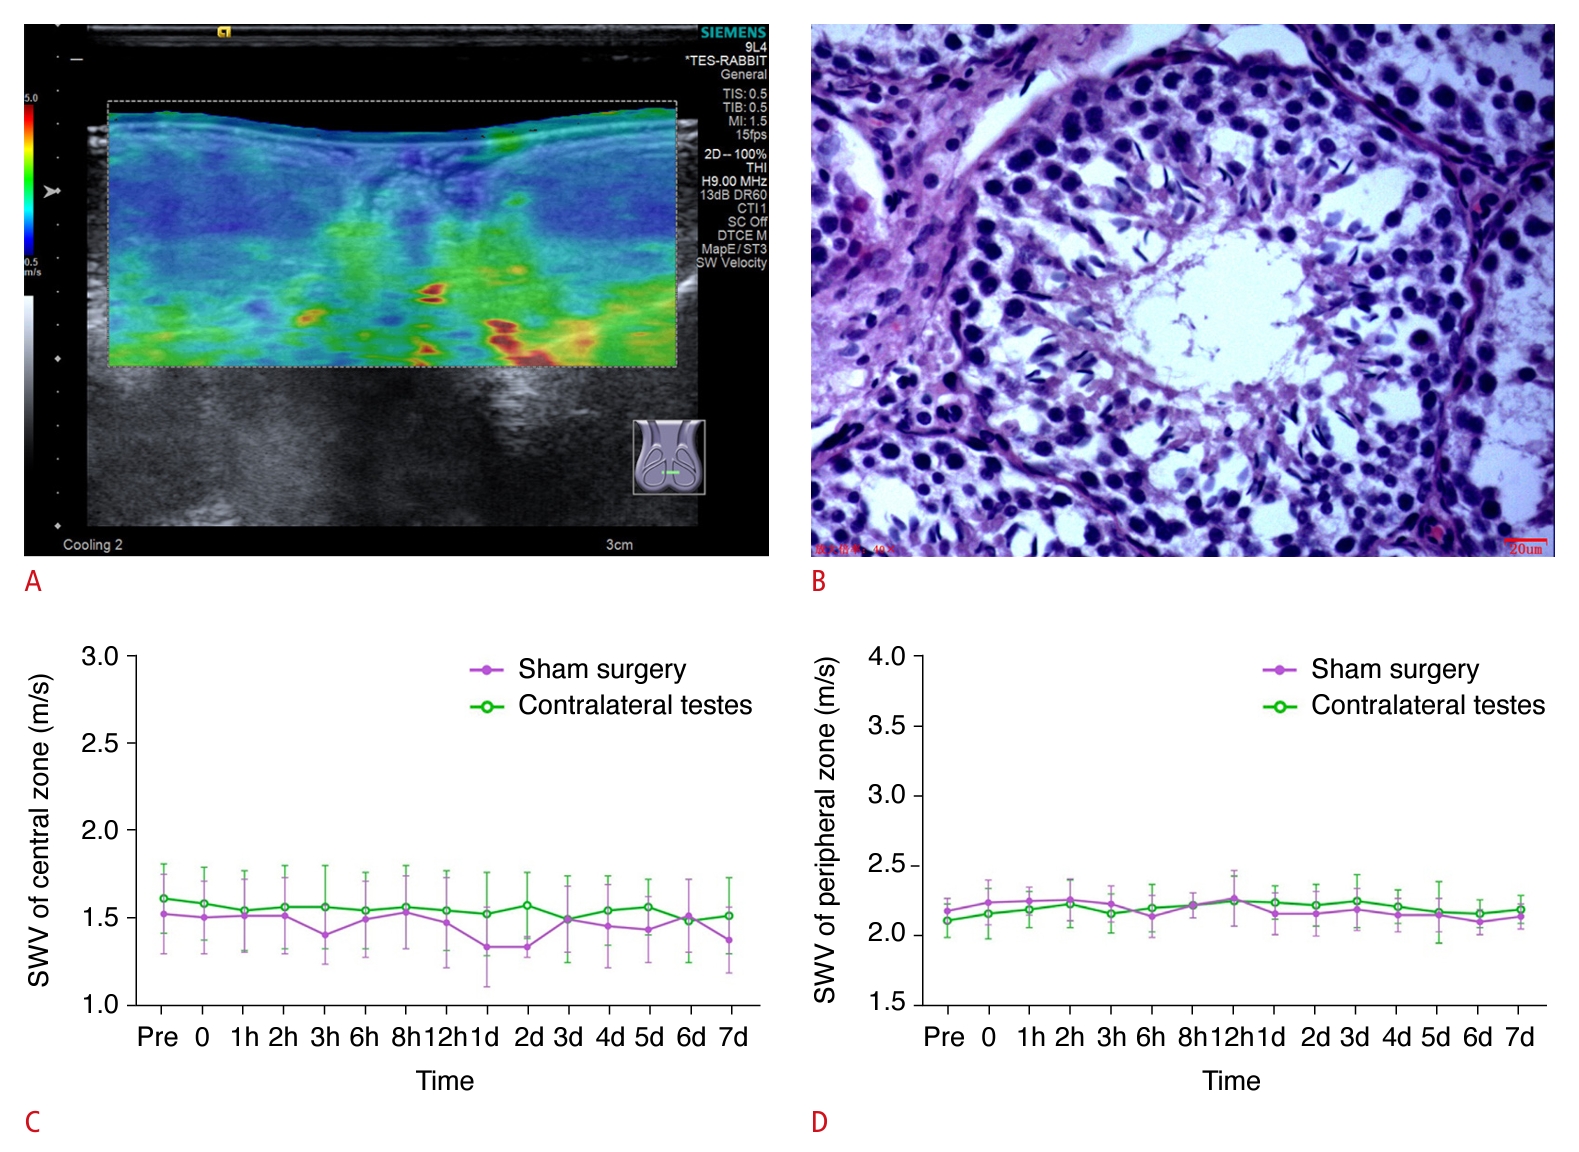
In the control group, the bilateral testes exhibited symmetrical star-like or cord-like blood flow patterns during both the preoperative and immediate postoperative periods, as observed via CDFI (Supplementary Fig. 2A, B). Additionally, during the immediate postoperative period, CEUS revealed that the testes subjected to sham surgery exhibited enhancement comparable to that in the healthy testes (Supplementary Fig. 2C). Within 7 days following surgery, the testes displayed a symmetric ovoid shape with medium homogeneous echogenicity and showed no evidence of hydrocele. SWE demonstrated that the central zone of the testes was stable with a uniform blue color, indicative of softness, while the peripheral zone was annular and uniformly green, suggesting a harder consistency. Additionally, SWV measurements in both the central and peripheral zones of the testes remained consistent. On the Johnsen scoring system, all testicular tissues were assigned a score of 10 within 7 days postoperatively, indicating that the sham operation did not adversely impact spermatogenesis (Fig. 2).
Imaging and Pathology of Complete Testicular Torsion
Among the animals with complete testicular torsion, both testes displayed symmetrical star-like or cord-like blood flow patterns during the preoperative period, as shown on CDFI (Supplementary Fig. 2D). Additionally, CDFI revealed an absence of intratesticular blood flow immediately following surgery (Supplementary Fig. 2E). In the immediate postoperative period, CEUS indicated no enhancement in the torsed testes (Supplementary Fig. 2F).
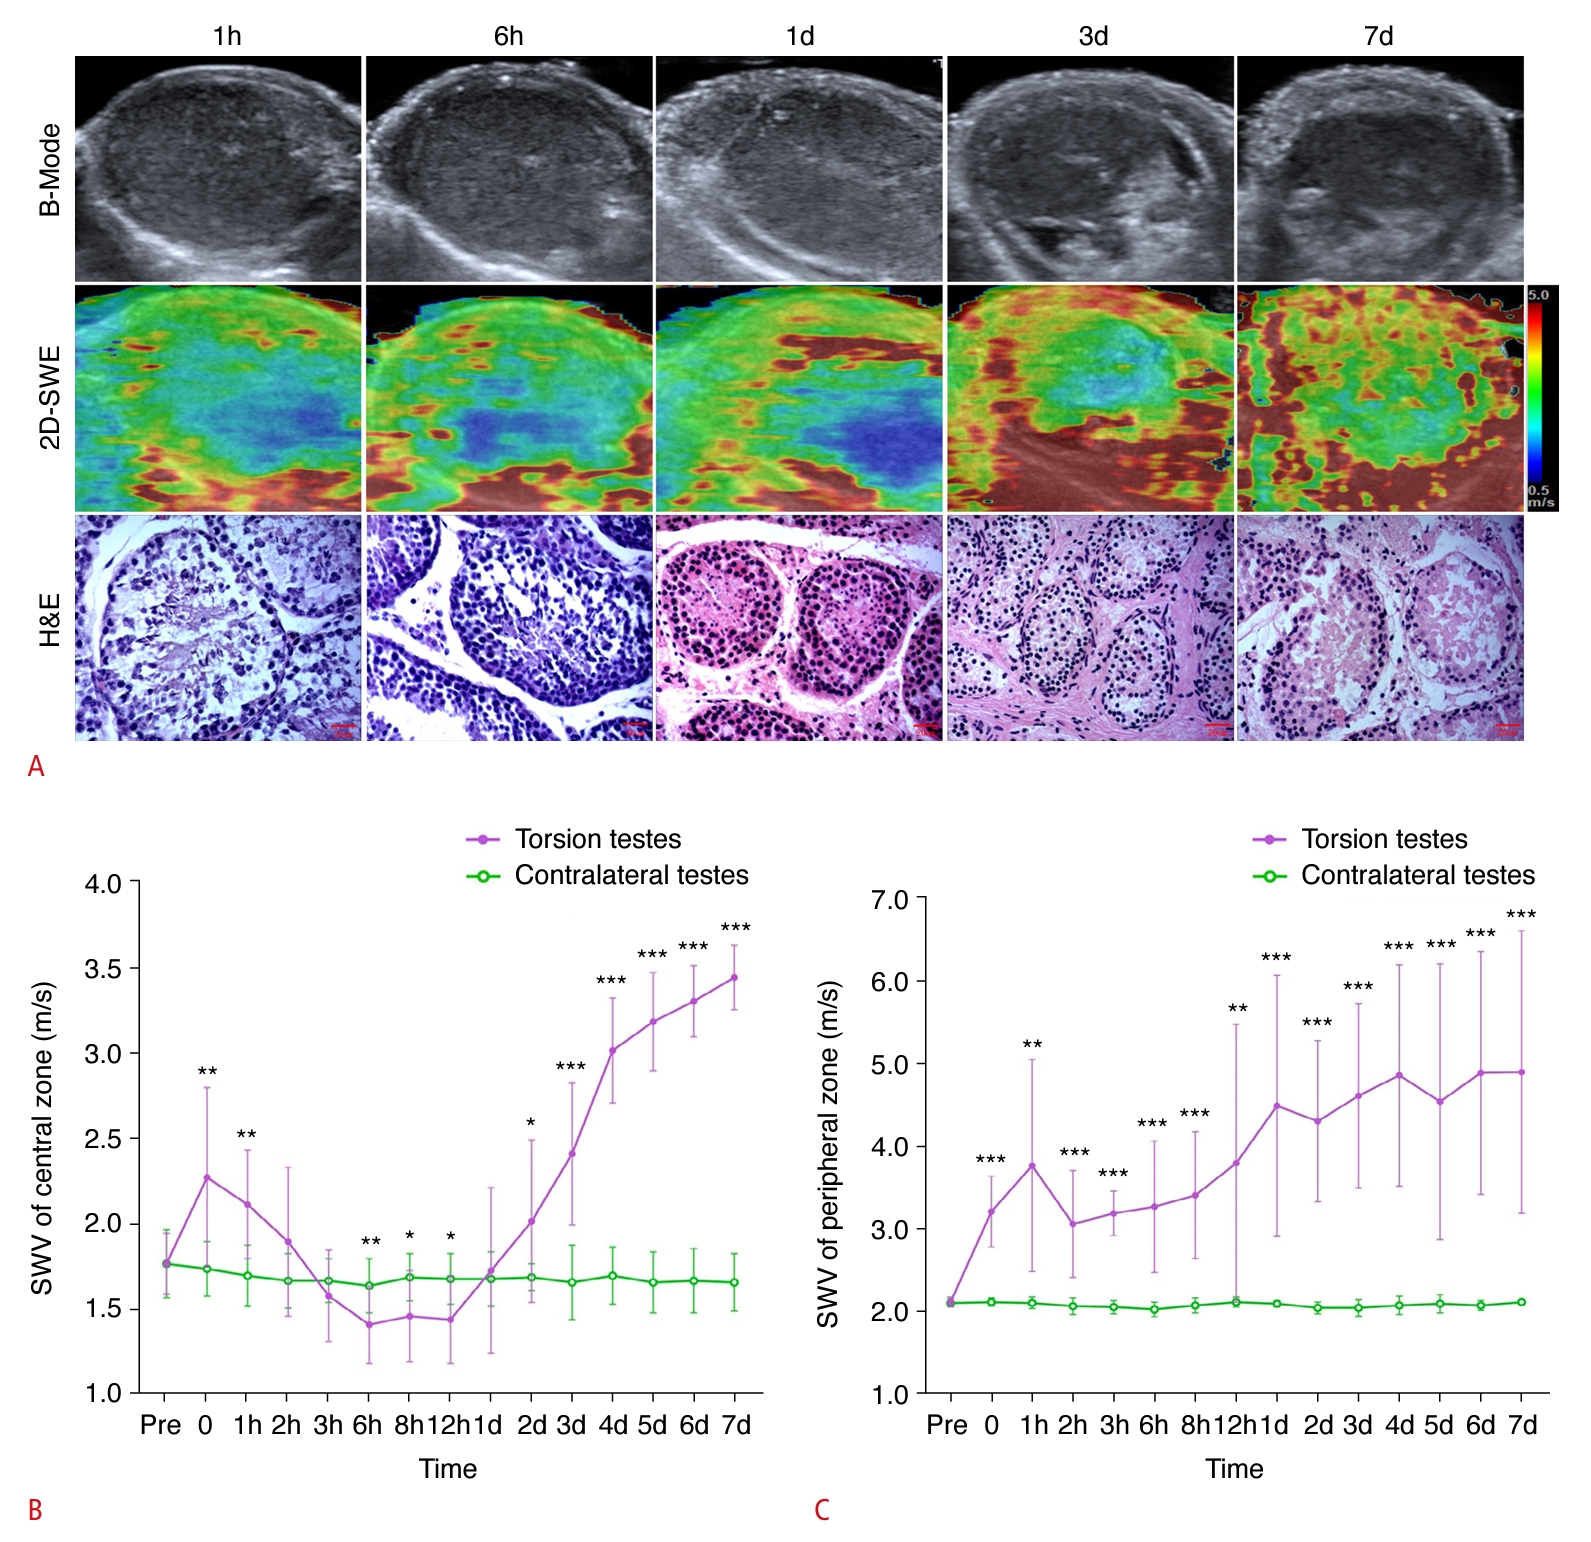
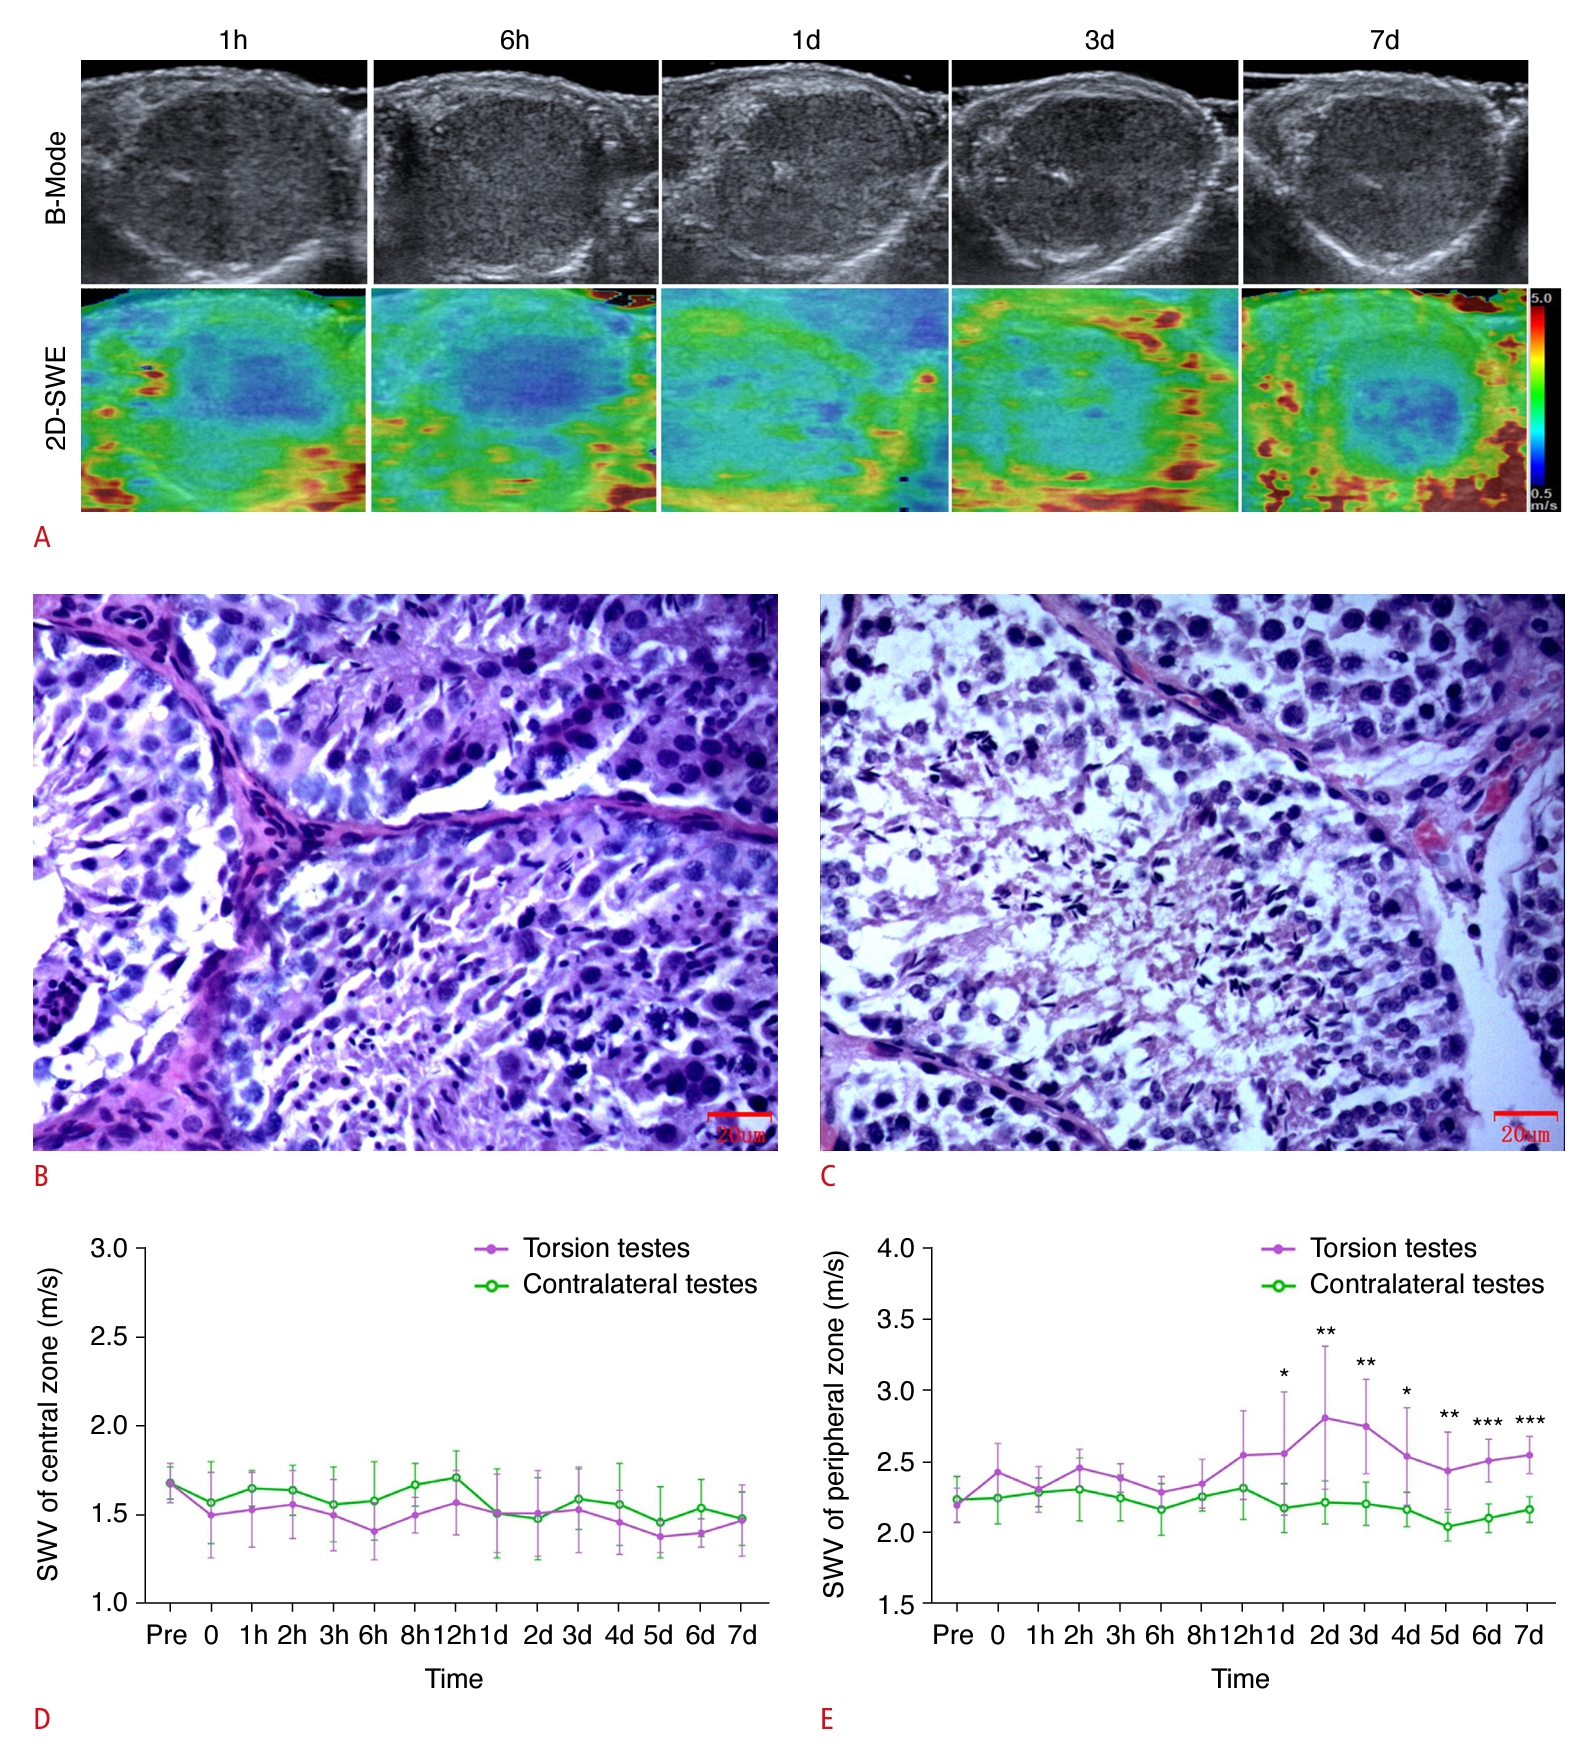
Beginning on the first day following surgery, a decrease was observed in the echogenicity of the testicular parenchyma, which exhibited an uneven distribution (Fig. 3A). Tubular structures were visible in the parenchyma, accompanied by swelling and thickening of the surrounding tissues. Two of the 12 rabbits (16.7%) exhibited postoperative hydrocele.
Immediately following surgery, the elastographic image of the central region of the testicular parenchyma appeared heterogeneous, with patches of red and green, signifying an increase in tissue stiffness. Over time, this image evolved into a consistent blue hue, which implied a reduction in stiffness. With a greater duration of torsion, the central blue region progressively shrank, and the stiffness correspondingly increased. Furthermore, the peripheral zone of the testes exhibited redness and increased stiffness after the operation. With prolonged torsion, the red area in the peripheral zone expanded and intensified in color, reflecting a rise in stiffness. Notably, from the first day after surgery, the peripheral zone of the testicles presented with a red ring, known as the "stiff ring sign."
SWV measurements in the central zone of the testicular parenchyma subjected to torsion, as shown on the largest standard transverse axis view, were significantly higher at various postoperative time points—immediately, at 1 hour, and on days 2 through 7—when compared with the contralateral testes. Notably, at 6, 8, and 12 hours postoperatively, the SWV measurements in the central zone of the torsed testicular parenchyma were significantly lower than those in the contralateral testes. This pattern indicates that the SWV measurements in the central zone increased immediately after surgery, then gradually decreased. Additionally, the SWV values were lower than those of the contralateral testes after 6 hours of torsion, showing a significant rise after 1 day of torsion. The SWV measurements in the torsed testicular parenchyma also demonstrated an increase immediately after surgery and continued to rise gradually in the peripheral zone (Fig. 3).
As depicted in Fig. 3, the testicular tissues subjected to torsion received a score of 9 on the Johnsen scoring system within 6 hours following surgery. Notably, the score for these torsion-affected tissues dropped to 5 only a single day after the procedure. Furthermore, the score of the testicular tissue affected by torsion gradually declined as the duration of torsion increased.
Imaging and Pathology of Incomplete Testicular Torsion
Among the rabbits with incomplete testicular torsion, one or more instances of cord-like intratesticular blood flow were detected on CDFI during the preoperative and immediate postoperative periods (Supplementary Fig. 2G, H). During the immediate postoperative period, CEUS revealed enhanced blood flow in the testes subjected to torsion, although the level of enhancement was weak compared to that observed in the healthy testes (Supplementary Fig. 2I).
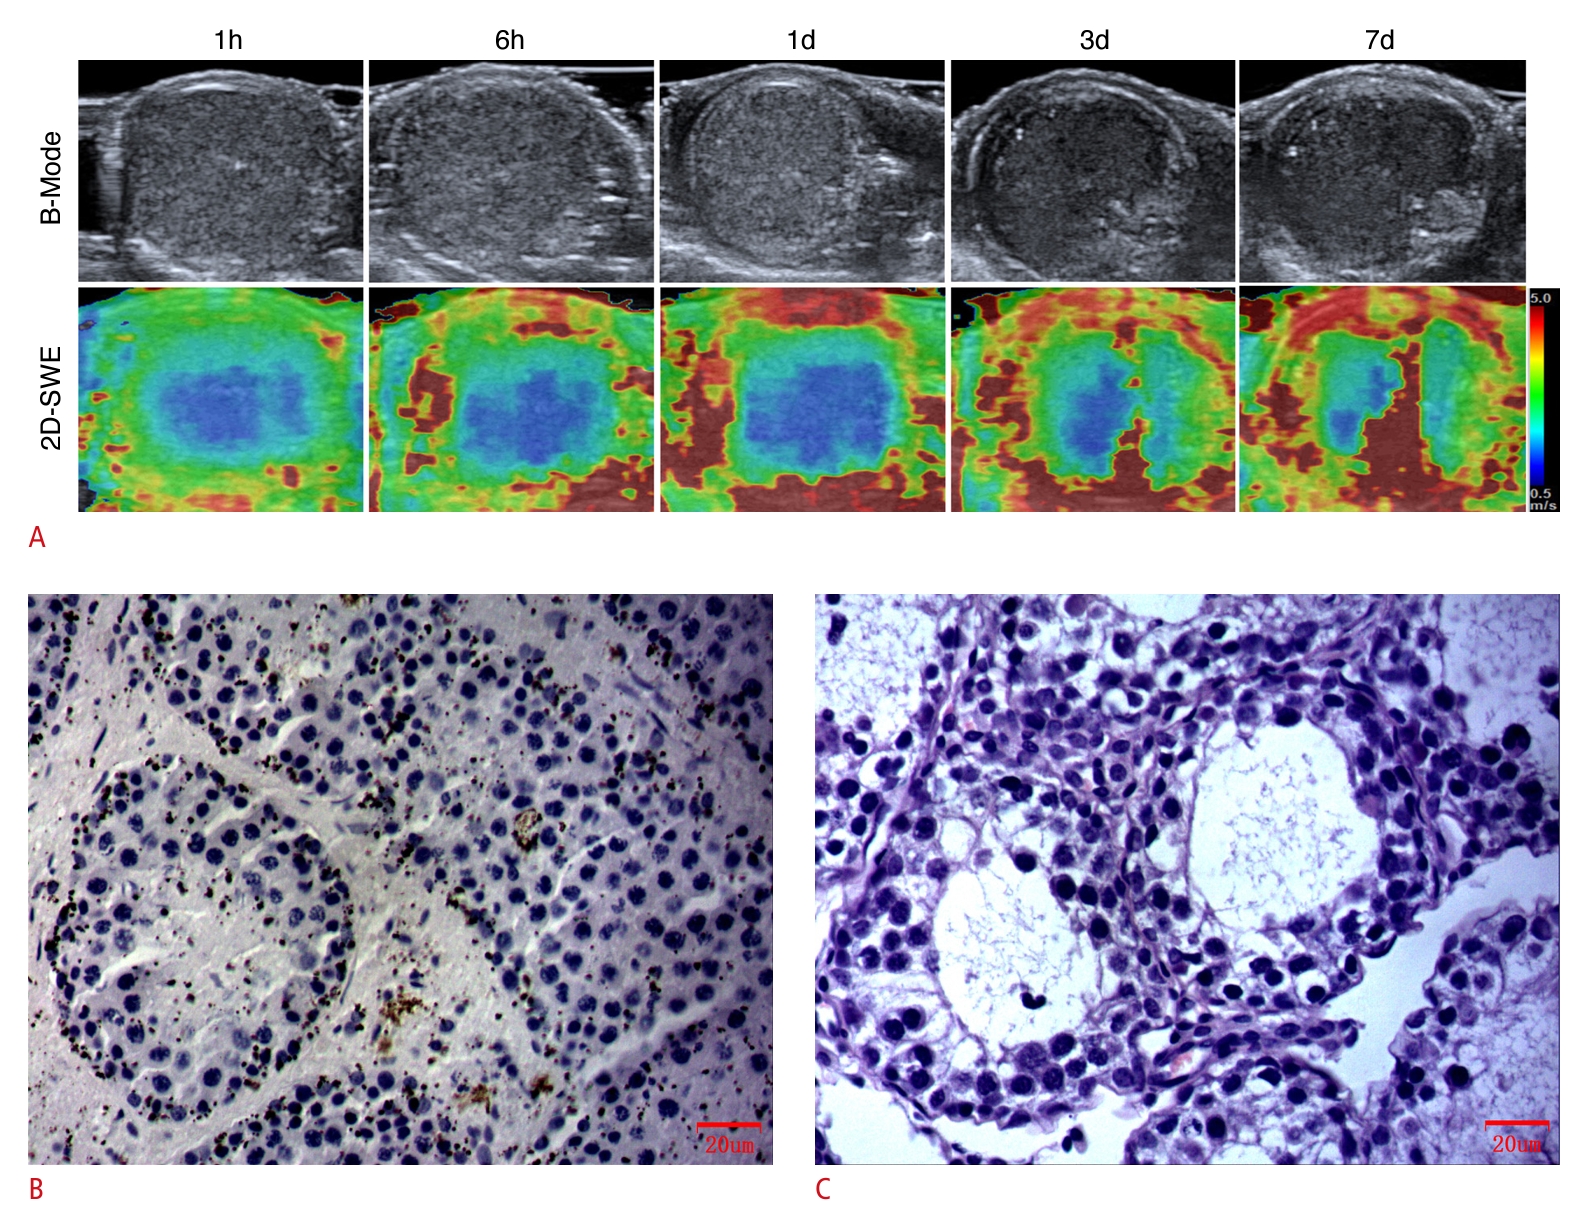
In the incomplete torsion group, eight of the 12 rabbits (66.7%) euthanized at the end of the experiment did not exhibit complete torsion within 7 days following the torsion event. Blood flow perfusion was consistently observed in the testes affected by torsion. The echogenicity of the testicular parenchyma appeared uniform and symmetrical with the contralateral testes. Elastography consistently represented the central zone of the testicular parenchyma in blue, indicating softness. From the first day after surgery, the peripheral zone began to display yellow and red hues, signifying an increase in stiffness. Moreover, no significant difference was found in the SWV measurements of the central zone between the testes subjected to torsion and the contralateral healthy testes at any postoperative time point. Notably, the SWV measurements taken in the peripheral zone of the torsed testicular parenchyma started to rise on the first day following surgery. According to the Johnsen scoring system, the tissues of the torsed testes achieved scores of 8 or 9 within 7 days after surgery (Fig. 4).
Within 1 day following torsion, the other four of the 12 experimental rabbits (33.3%) demonstrated complete torsion at various time intervals. An absence of blood flow perfusion was evident in the testes affected by torsion. The peripheral zone of these testes displayed the "stiff ring sign." Commencing on the second postoperative day (the day after achieving complete torsion), the echogenicity of the testicular parenchyma progressively decreased, while also becoming uneven. Within the parenchyma, tubular structures became apparent, surrounded by swollen and thickened tissue. Utilizing the Johnsen scoring system, testicular tissues subjected to torsion received a score of 5 on postoperative day 7 (Fig. 5). These findings aligned with those observed in the group with complete testicular torsion.
Use of SWE to Assess the Extent of Damage to Testicular Spermatogenesis Due to Torsion
Fig. 6A depicts the associations between SWE measurements in the central and peripheral regions of the testicular parenchyma impacted by testicular torsion and the process of spermatogenesis. SWE measurements from both central and peripheral areas demonstrated significant negative correlations with spermatogenesis, with coefficients of r=-0.759 (P<0.001) and r=-0.696 (P<0.001), respectively.
As presented in Supplementary Table 2, the rabbits were categorized based on histological changes observed in the testes. The groups with complete and incomplete testicular torsion were classified according to the state of spermatogenesis as follows: normal testicular spermatogenesis (n=0), hypospermatogenesis (n=15), spermatogenic arrest (n=24), Sertoli cell-only syndrome (n=0), and absence of seminiferous tubules (n=1). The AUCs of SWE measurements in the central or peripheral zones of the torsed testicular parenchyma were 0.886 (sensitivity, 83.3%; specificity, 100%) and 0.824 (sensitivity, 83.3%; specificity, 73.3%) for distinguishing between hypospermatogenesis and spermatogenic arrest, respectively (P=0.451, DeLong test) (Table 2, Fig. 6B).
Discussion
In clinical practice, the present authors noted that changes in the stiffness of testes impacted by torsion did not appear to correspond with the condition’s progression. This observation prompted the need for additional research to investigate variations in the stiffness of torsed testes at different stages of the disease. The present findings reveal that changes in stiffness within the central and peripheral zones of the testicular parenchyma differ according to the degree of torsion, and the stiffness of the torsed testes is not synchronized with progress in tandem with disease duration. After complete torsion, the stiffness of the central zone initially increases, then decreases to a value lower than that of a normal testis, before increasing again to exceed normal testicular stiffness after the first postoperative day. In contrast, the stiffness of the peripheral zone remains consistently higher than normal following complete torsion. In cases of incomplete torsion, the stiffness of the central zone does not exhibit a significant difference from normal measurements unless the torsion becomes complete. The "stiff ring sign" is a characteristic indicator of testicular torsion that is detectable through SWE. Additionally, SWE is useful in identifying damage to spermatogenesis in testes affected by torsion.
In this study, when partial testicular torsion occurred—characterized by the presence of blood flow within the testicular parenchyma—the ultrasound image of the testicular parenchyma appeared uniform and symmetrical relative to the contralateral testis, suggesting that spermatogenic function was intact. Notably, when the testis underwent complete torsion or progressed from partial to complete torsion, a marked reduction was observed in the echogenicity of the parenchyma, which became irregular approximately 24 hours following the cessation of blood flow. These reduced and uneven parenchymal echoes were a direct consequence of ischemia and necrosis in the affected testicle, which led to a significant decrease in spermatogenic function. Similar observations have been reported by Dogra et al. [3].
The tolerance for testicular torsion in rabbits, like that in humans, exhibited variation. In the incomplete torsion subgroup, some rabbits (8 of 12, or 66.7%) did not develop complete torsion within the full 7-day period. However, the remaining four rabbits (33.3%) did progress to complete torsion at various times within the first 24 hours following the torsion event. Crucially, in instances of testicular torsion, as long as blood flow was evident within the testicular tissue (indicating incomplete torsion), the central zone consistently displayed a blue hue, signifying softness. Notably, when the testicle underwent complete torsion or transitioned from incomplete to complete torsion, the color of the elastographic image in the central zone became irregular. This mix of red and green hues indicated an increase in stiffness, then eventually changed to a uniform blue color, denoting a reduction in stiffness. Upon initial inspection, a significant increase in stiffness was evident in the peripheral zone of the testicle. By examining the histopathology, specifically regarding the presence of spermatogenic function, it was inferred that this finding could stem from a condition termed testicular compartment syndrome, as described by Kutikov et al. [20]. Those authors suggested that the heightened intracompartmental pressure (ICP) within the testicle following acute torsion likely resulted from the physiological response in which the intratesticular blood volume increased, causing a rise in ICP due to the blockage of venous outflow in the spermatic cord before arterial inflow ceased. As the body adjusted over time, the central zone of the testicles softened. However, as the duration of torsion extended—specifically when the testicles were completely twisted for more than 1 day—gradual shrinkage was observed of the middle blue area, indicating an increase in stiffness. SWE quantitative analysis revealed increasing stiffness in the twisted testicle, which suggested a progressive exacerbation of ischemic necrosis. This, in turn, resulted in a deterioration of spermatogenic function. Importantly, the stiffness of the peripheral zone of the testicle gradually increased with the duration of torsion. A "stiff ring sign" was observed to emerge 1 day after the torsion event. This finding aligns with clinical follow-up observations by Xue et al. [15], who characterized the "stiff ring sign" as a distinctive elastographic feature that can be used to effectively differentiated between testicular torsion and acute orchitis.
SWE has been extensively utilized in assessing liver fibrosis, breast tumors, and thyroid nodules [10-13]. However, research on the role of SWE in testicular torsion and its predictive value for spermatogenesis after torsion has been limited [14-16]. The present study demonstrated that testicular stiffness can predict testicular spermatogenesis following torsion. First, SWE measurements in both central and peripheral zones of the torsed testicular parenchyma exhibited a high linear correlation with spermatogenesis (r=-0.759 and r=-0.696, respectively). Additionally, the AUCs of SWE measurements in the central or peripheral zones of the torsed testicular parenchyma were 0.886 and 0.824 for distinguishing between hypospermatogenesis and spermatogenic arrest, respectively. Moreover, SWE measurements in the central region demonstrated greater specificity and positive predictive value (PPV) for differentiating between hypospermatogenesis and spermatogenic arrest compared to the peripheral region (specificity, 100% vs. 73.3%; PPV, 100% vs. 83.3%). Consequently, SWE assessment of the central region on the largest standard transverse axis view of the torsed testicular parenchyma was significantly superior to that of the peripheral region in distinguishing between hypospermatogenesis or spermatogenic arrest.
The present study had several limitations. First, the number of cases involving incomplete progression to complete torsion was relatively small, rendering it insufficient for statistical analysis. Second, histological examination showed that rabbits from both complete and incomplete testicular torsion groups rarely, if ever, yielded samples that exhibited normal testicular spermatogenesis, Sertoli cell-only syndrome, or the absence of seminiferous tubules. Consequently, additional research is necessary with an expanded sample size for a more comprehensive analysis. Third, the scope of this study was limited to the continuous ultrasonographic monitoring of testicular torsion in rabbits, and its applicability to humans has not been assessed.
In conclusion, the stiffness of both central and peripheral regions of the testicular parenchyma changes in relation to the degree and duration of torsion, exhibiting a specific pattern. The "stiff ring sign" is the characteristic SWE finding associated with testicular torsion. SWE appears to aid in the non-invasive differentiation of the extent of spermatogenic damage in torsed testes.


 Download Citation
 PDF Links
 PubReader
 ePub Link
 Full text via DOI


