

 Print
Print facebook
 twitter
 Linkedin
 google+

Introduction
Liver shear wave elastography (SWE) is a rapidly developing ultrasonographic technique that evaluates liver stiffness through shear wave speed measurements in liver tissue of patients with liver fibrosis or cirrhosis [1-3]. Liver SWE has been increasingly used as a quantitative biomarker for evaluating new drugs or treatments, such as anti-viral agents and anti-fibrotic agents [4]. In the clinical field, the physics and manufacturing techniques, measurement variability, quality criteria, and procedures for performing elastography have been extensively investigated, and have now become standardized through the emergence of an international consensus [5-7]. As such, the World Federation for Ultrasound in Medicine and Biology (WFUMB) issued guidelines on the use of SWE for the assessment of liver diseases in 2015 and 2018 [8,9].
In preclinical trials, the use of liver elastography has also become increasingly common as part of accelerated drug development efforts for anti-fibrotic agents for chronic liver disease and anti-viral agents for chronic hepatitis [4]. Non-invasive monitoring tools in mouse or rat models are very useful for assessing the treatment response to new drug candidates. In this regard, ultrasonographic SWE in preclinical trials might be a very powerful tool, as long as its technical feasibility is validated and repeatability is ensured. Currently, clinical ultrasonographic machines are readily available for SWE in a rat liver fibrosis model, thereby facilitating the use of SWE in preclinical trials. In contrast, other liver elastographic techniques such as magnetic resonance elastography (MRE) are very rarely used in preclinical models, because MRE requires a customized animal coil and electromechanical driver [10].
With regard to technical feasibility, several prior studies have investigated SWE techniques in rat liver fibrosis models and reported that SWE biomarkers reflected pathologic processes and outcomes [11,12]. However, the methods slightly differed across studies, and a standardized method of performing SWE has not been established in rat liver models. In addition, only sparse reports have been published on the repeatability of SWE in rat models [13], even though the repeatability of SWE in phantom studies and clinical studies has been thoroughly established [14-17]. Before using SWE as a quantitative biomarker for new drug development or for assessing treatment response, the repeatability of measurements must be ensured.
From this perspective, we performed an animal study to establish a standardized operating procedure (SOP) to perform ultrasonographic SWE and evaluated the test-retest repeatability of SWE in a rat liver fibrosis model.
Materials and Methods
Animal Model
All experiments conducted as part of this study were approved by our institutional animal care and use committee. A drug-induced chronic liver injury model was adopted to generate liver fibrosis. All Sprague-Dawley rats (male, 8 weeks old, weighing 270-280 g) were obtained from Orient Bio (Seoul, Korea) and maintained under specific-pathogen-free conditions.
Thioacetamide (TAA; Sigma-Aldrich Co., St. Louis, MO, USA), which is a hepatotoxic agent that causes centrilobular necrosis, was used to model drug-induced liver injury [4]. To minimize any potential selection bias on the part of the researcher, 34 rats were randomly assigned to three groups using a computerized random number generator (https://randomizer.org). The assignment resulted in eight rats in the control group, 11 rats in the low-dose group, and 15 rats in the high-dose group.
Intermittent intraperitoneal injections of TAA or saline were administered 3 times per week for 8 weeks. The doses administered were 200 mg/kg of TAA in the high-dose group, 150 mg/kg of TAA in the low-dose group, and 500 μL of saline in the control group [18-20]. The TAA dose was determined by a preliminary experiment (results not shown) using 11 rats administered 0 (n=1), 100 (n=3), 150 (n=2), 200 (n=3), and 250 mg/kg (n=2) of TAA. A dose of 100 mg/kg did not induce liver fibrosis consistently, and a dose of 250 mg/kg resulted in death of all rats during the TAA medication period. Based on those results, doses of 150 mg/kg and 200 mg/kg were selected for this experiment.
After 8 weeks of TAA medication, SWE examinations were performed in two measurement sessions at a 3-day interval to evaluate the test-retest repeatability of the entire process of liver stiffness measurements, including animal preparation, anesthesia, and SWE examinations.
Histopathologic Evaluation as Reference Standards
After the second SWE examination, the animals were euthanized in a carbon dioxide chamber. We performed en bloc resection of the liver and then sliced it cross-sectionally at 5-mm intervals. The excised tissues were then fixed in 10% formalin and embedded in paraffin blocks. Hematoxylin and eosin (H&E) staining was performed for a microscopic evaluation of the liver parenchyma. We requested the Experimental Animal Histopathology Laboratory in our institution to conduct a histopathologic examination of the liver. Liver fibrosis was analyzed based on the presence of portal fibrosis (fibrous portal expansion), periportal fibrosis (periportal fibrosis with short septa extending into the lobules or porto-portal septa), septal fibrosis (fibrous septa reaching the adjacent portal tracts and terminal hepatic venule), or cirrhosis (diffuse nodular formation). Liver inflammation was assessed based on the presence of inflammatory cells (neutrophils and lymphocytes) in the lobules. Liver steatosis was evaluated based on the presence of lipid accumulation in the hepatocyte vacuoles.
The Masson trichrome stain was performed to evaluate the extent of liver fibrosis using a commercially available kit (Sigma-Aldrich Korea, Seoul, Korea), which stains collagen blue. The area of collagen was quantified with ImageJ software (National Institutes of Health, Bethesda, MD, USA) using the following steps: (1) five representative hotspots were determined at a lower magnification (×40), (2) those areas were captured and digitized for morphometric analysis, and (3) areas of collagen were selected using the colorimetric threshold of the blue color [21,22]. If ImageJ did not automatically select areas of collagen, we adjusted the areas manually using the H&E stain as a reference [23]. The area of collagen as a percentage (area of blue pixels/area of selected rectangle) from the five hotspots was averaged and used for statistical analysis.
Shear Wave Elastography
Two-dimensional SWE was acquired with an Aplio 500 Platinum ultrasound machine (Canon Medical Systems Corp., Tokyo, Japan) using a linear probe (14L5 transducer, 5.0-14.0 MHz). SWE was performed by a single operator (Y.C.C.), a radiographer with 2 years of experience in SWE, TE, and liver Doppler ultrasonography in our clinical unit and 3 years of experience in animal ultrasonographic imaging at our animal imaging center. A supervising radiologist (J.H.) with 2 years of experience in SWE and 10 years of experience in abdominal ultrasonography checked the measurement process. During the preliminary experiments, the SOPs were established mainly based on the WFUMB guidelines [8,9], and the operator received training in the SOPs. The SOPs are presented in detail in Supplementary Data 1.
The rats were fasted for 4 hours before testing. Under anesthesia with isoflurane, each rat was positioned in the supine position with both anterior limbs abducted. After shaving the upper abdomen, the transducer was gently applied with a large amount of sonographic gel warmed to 37ºC to achieve a good acoustic window, while avoiding stiffness artifacts radiating from the contact area, hand motion, and pressure. Measurements were taken through a subcostal approach at the location of the best acoustic window of the left hepatic lobe. If possible, the transducer was held perpendicular to the liver capsule. The operator measured the liver stiffness at a depth of approximately 1 cm from the probe surface in all animals.
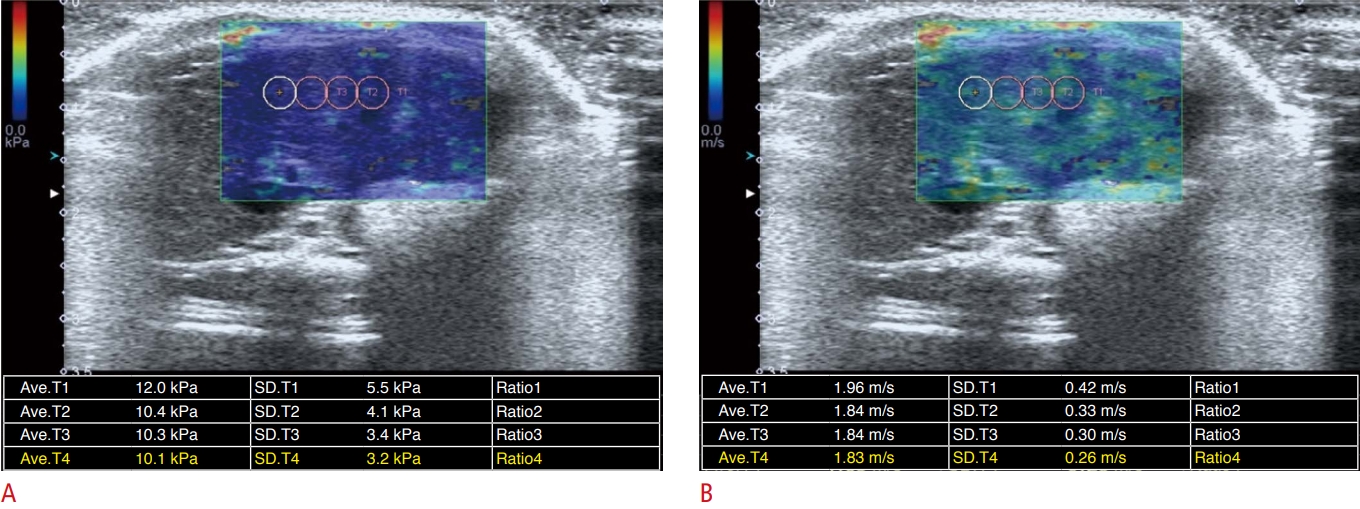
In each SWE examination, liver stiffness measurements in kilopascals (kPa) were made eight times in the same location by placing a sampling box (i.e., a field of view), where a color map was displayed. For each measurement, the radiographer drew several (generally three or four) regions of interest (ROIs) with a diameter of 0.3 cm away from the large vessel and bile duct. Then, the radiographer and supervising radiologist chose an ROI that was placed in the area of greatest shear wave uniformity, demonstrating a relatively homogeneous color on the liver stiffness map and speed map (Fig. 1). Of the eight measurement values, we selected the median value from each SWE examination as the liver stiffness value.
During measurements of liver stiffness, we did not consider the interquartile/median (IQR/M) value as a quality check criterion. After finishing our experiment, we manually calculated the IQR/M values of the eight measurements in each SWE examination.
Statistical Analysis
The mean values and standard deviation (SD) were determined for all SWE examinations for each group in each measurement session. Repeated-measures analysis of variance (RMANOVA) was used to compare the mean values of liver stiffness (kPa) between measurement sessions and across groups. Other quantitative values were compared using the Student t-test, Fisher exact test, or oneway analysis of variance, with post-hoc analysis using the Tukey-Kramer method. Pearson correlation coefficients were calculated to evaluate correlations between liver stiffness (kPa) and collagen area. A P<0.05 was considered to indicate statistical significance. MedCalc version 17.7.2 (MedCalc Software bvba, Ostend, Belgium) was used for all analyses.
The measurement variability of liver stiffness between the first session and the second session was evaluated as follows: (1) In each group, the coefficient of variation (CoV) was calculated by dividing the SD by the mean liver stiffness value, and the CoV was compared between sessions using the Levene test. (2) In each SWE examination, the IQR/M value was calculated, and the mean IQR/M values of all SWE examinations were compared between sessions using the Student t-test [24].
To determine test-retest repeatability, we calculated the repeatability coefficient and within-subject coefficient of variation (WSCV), which are statistical methods recommended by the Quantitative Imaging Biomarker Alliance (QIBA), using a web-based calculator (available at http://datasharing.aim-aicro.com/reliability) [25-27]. Test-retest repeatability was also evaluated using Bland-Altman plots with a mean relative difference (percentage) and 95% limits of agreement (LOA) [28]. The agreement between measurements from the first and second sessions was visually assessed using Bland-Altman plots, in which the relative difference between the two measurements was plotted against the average value. The 95% LOA is the range of values within ±1.96 SD of the mean relative difference.
Results
Histopathologic Characteristics of the Animal Models
Among the 34 rats, three (two in the low-dose group and one in the high-dose group) died during the 8 weeks of TAA injection. Finally, eight rats in the control group, nine in the low-dose group, and 14 in the high-dose group were included in this study. Signs of toxicity, such as ruffled fur, anorexia, cachexia, skin tenting, skin ulcerations, or toxic death were not seen in any of the surviving rats.
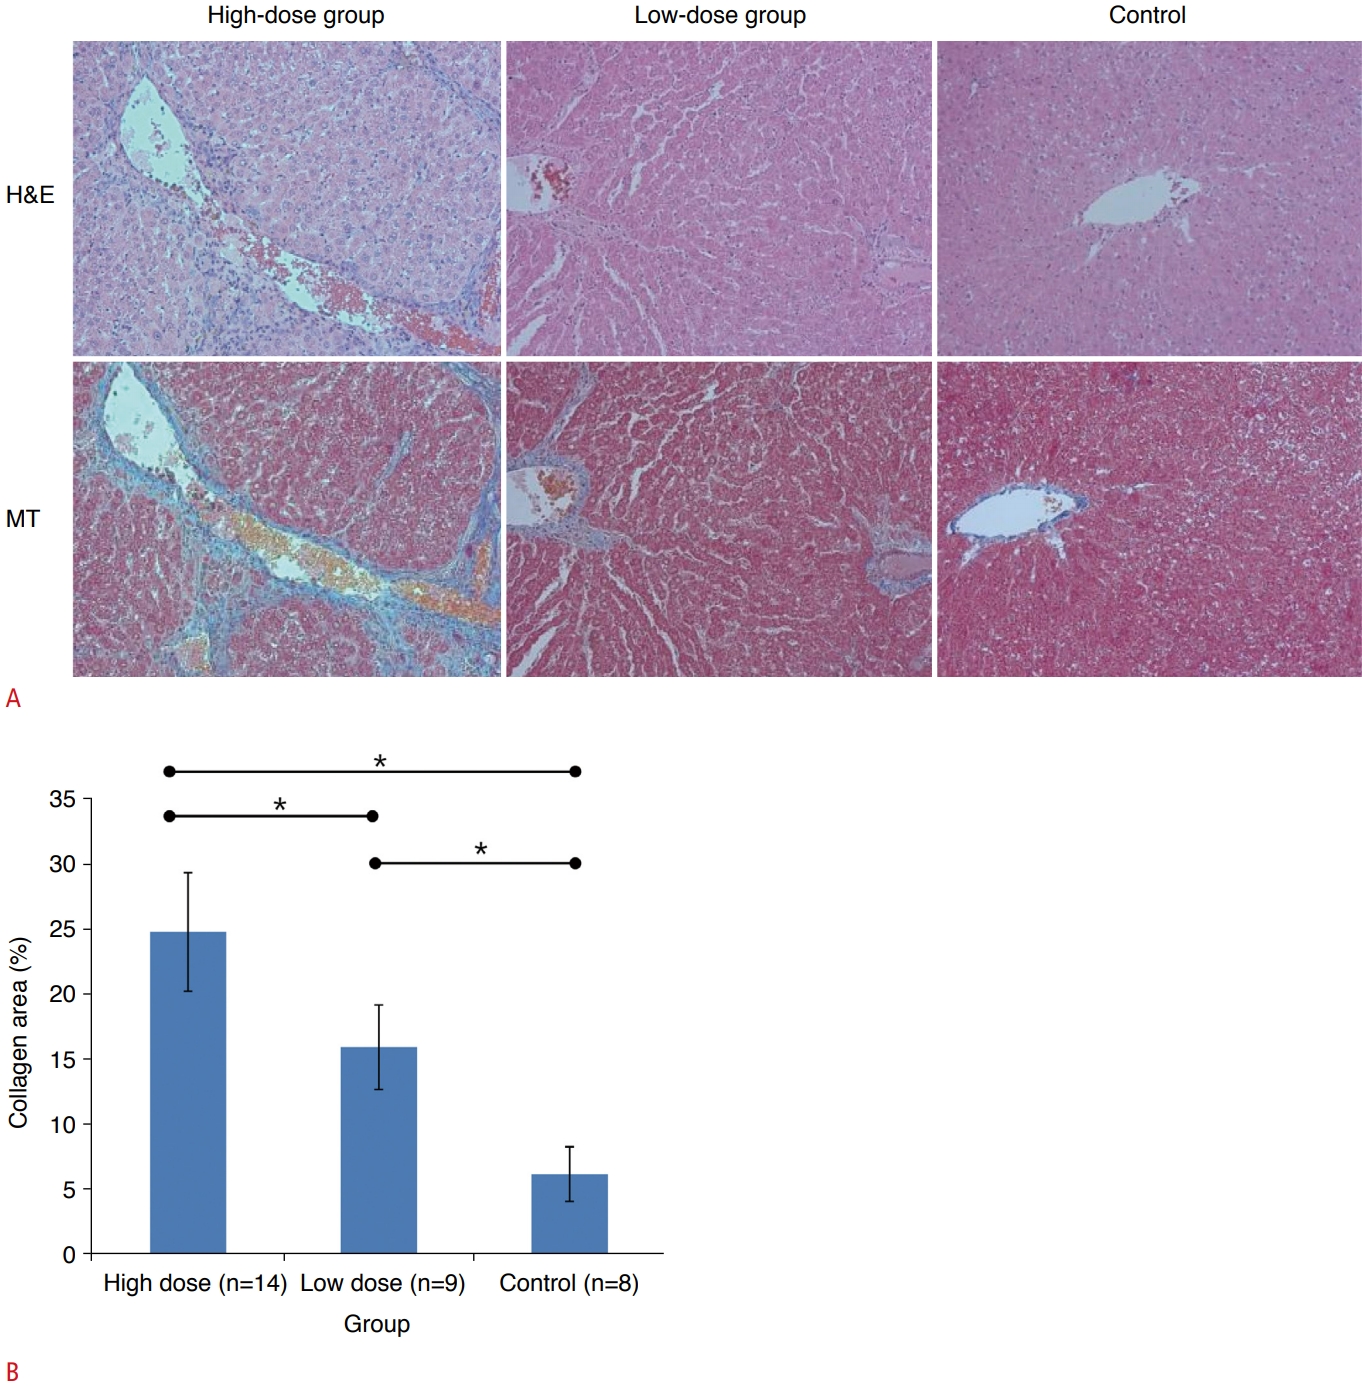
All rats in the control group showed normal histologic findings without fibrosis, inflammation, or steatosis. Based on the histopathologic results, liver fibrosis with abundant collagen deposits was successfully induced in all rats in both the low-dose and high-dose groups (Fig. 2A). The areas of collagen were most extensive in the liver histopathologic specimens of the high-dose group (24.86%±4.55%), followed by the low-dose group (16.01%±3.25%) and the control group (6.27%±2.10%), as presented in Fig. 2B. Post-hoc multiple comparison analysis revealed that all pairs were significantly different (P<0.05, Tukey-Kramer test).
SWE per Group
The mean values of the first and second liver stiffness measurements were 8.88±1.48 kPa in the control group, 11.62±1.70 kPa in the low-dose group, and 11.91±1.73 kPa in the high-dose group. Liver stiffness differed significantly between groups (P<0.001; between-subjects effects; RMANOVA). A post-hoc analysis showed that liver stiffness significantly differed between the control group and low-dose group (P<0.001), as well as between the control group and high-dose group (P<0.001), but did not differ between the low-dose and high-dose groups.
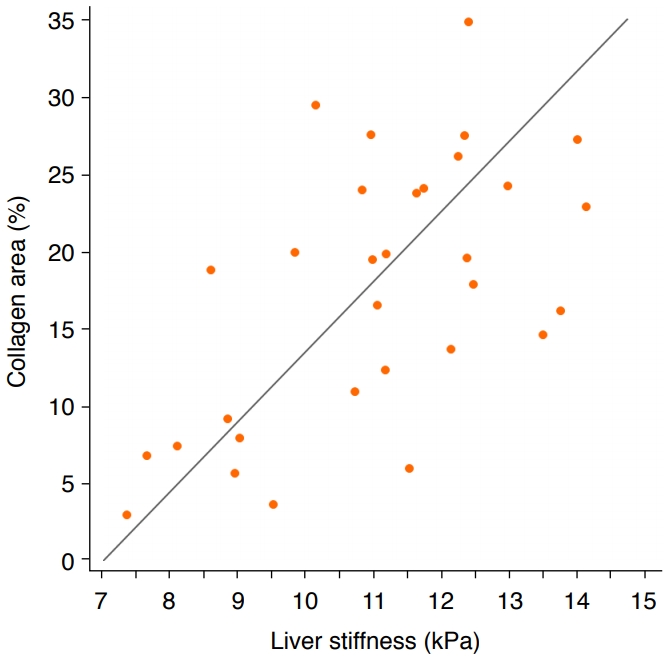
Regarding the correlation between liver stiffness and liver fibrosis, a significant positive correlation was found between mean liver stiffness measurements and the areas of collagen in the liver specimens (r=0.6, P=0.005) (Fig. 3).
SWE per Session
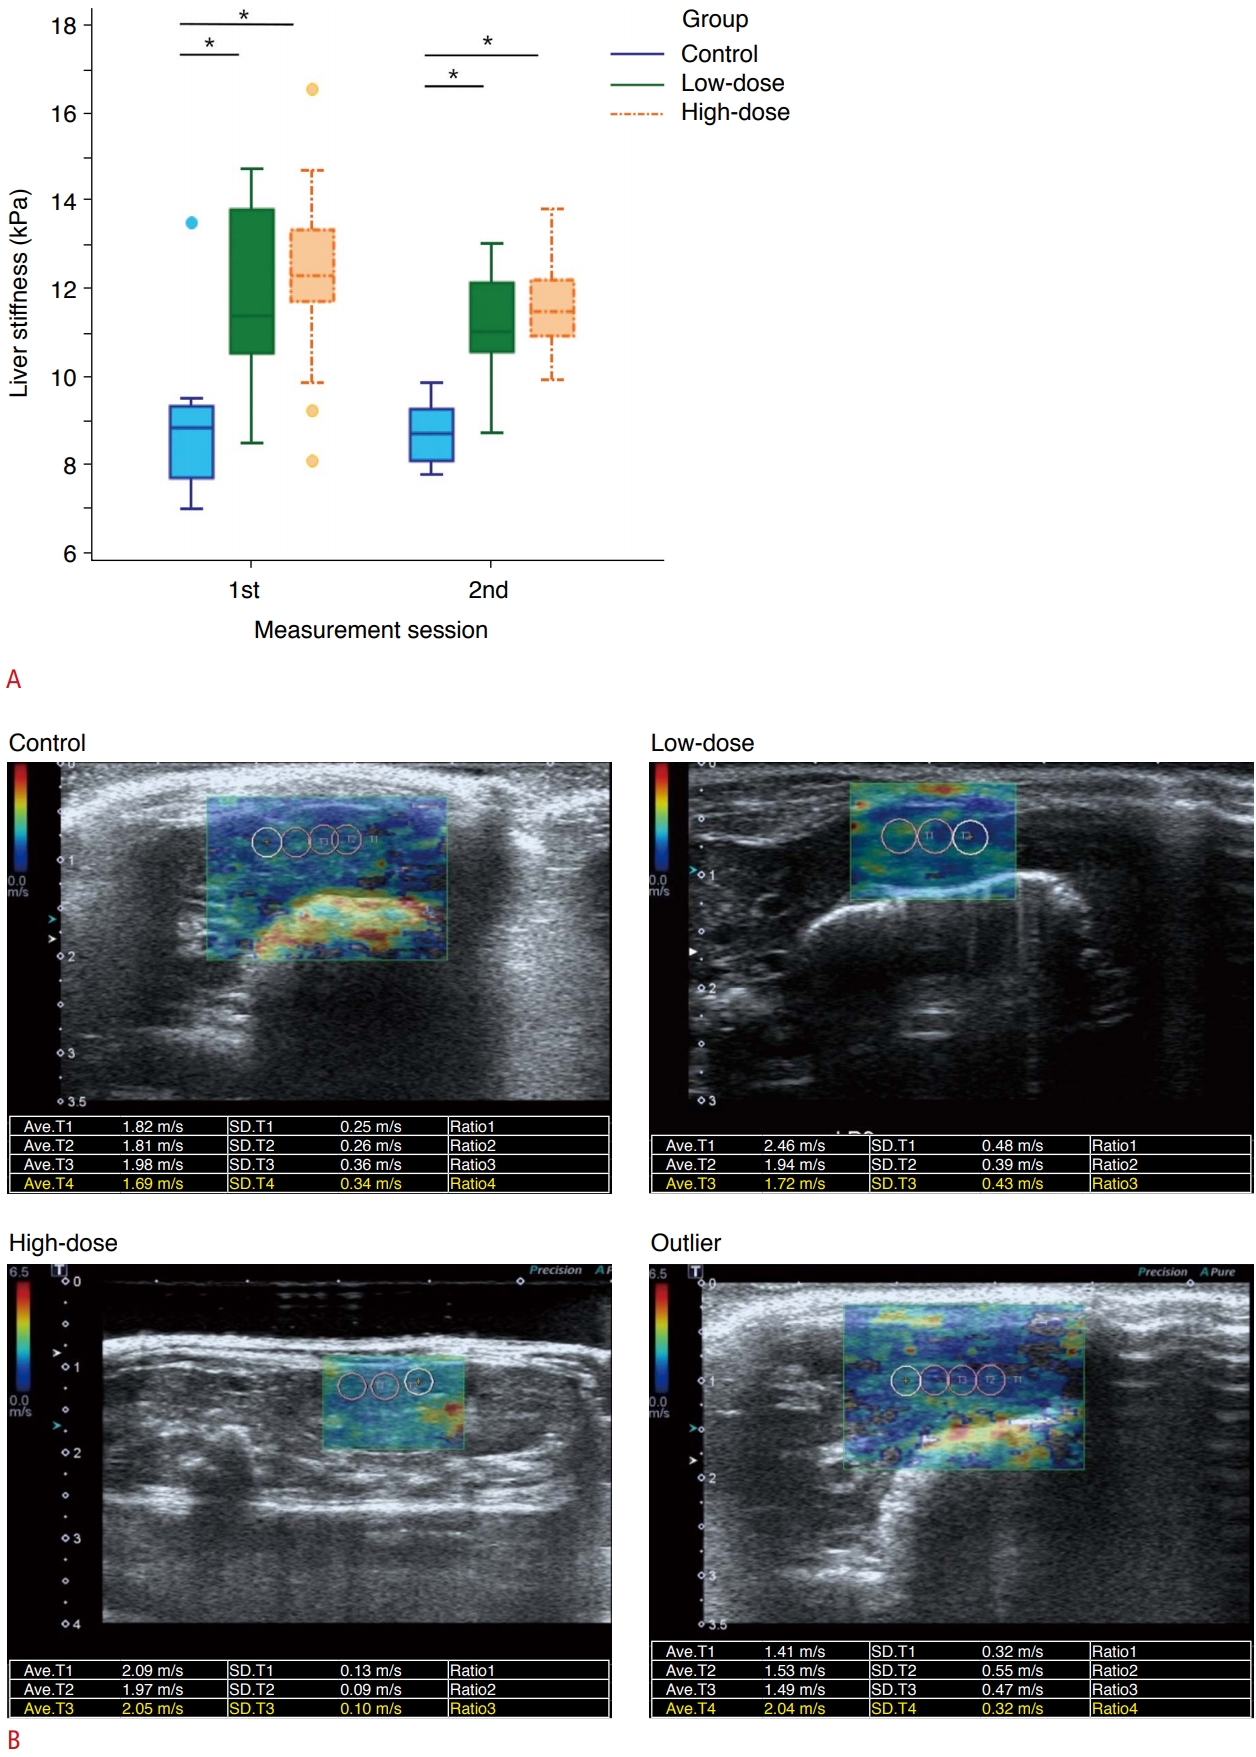
The box-and-whiskers plots of liver stiffness measured at the first and second sessions are presented in Fig. 4A. When comparing the first and second measurement sessions, no significant difference was found in the mean values between the first and second measurements in all groups (P>0.05; within-subject effects; RMANOVA).
However, as presented in Table 1, the second measurement session yielded more reliable results than the first measurement session, as follows: (1) the CoV, a measure of variability in a group, was higher in the first session than the second session (P<0.001 in all groups), and (2) the mean values of IQR/M, a measure of variability in an SWE examination, were also higher in the first session than the second session (0.21±0.12 vs. 0.12±0.08, P<0.001). In addition, four outliers were present in the first session, but not in the second (Fig. 4B).
Repeatability Coefficient
The repeatability coefficient of liver stiffness between the first and second measurement sessions was 3.75 kPa (95% confidence interval, 3.01 to 4.99 kPa; WSCV, 12.26%). In the Bland-Altman analysis, the 95% LOA was -3.05 to 4.22 kPa. When the four outliers were removed, the repeatability coefficient decreased to 2.82 kPa (95% confidence interval, 2.24 to 3.85 kPa; WSCV, 9.29%) and the Bland-Altman 95% LOA also became narrower (-2.12 to 3.21 kPa) (Fig. 5).
Discussion
In our experiment, we evaluated short-term test-retest repeatability at a 3-day interval in a rat liver fibrosis model, in order to provide repeatability data for preclinical trials for anti-fibrotic agents. The repeatability coefficient of liver stiffness between the first and second measurement sessions was 3.75 kPa (WSCV, 12.26%) which decreased to 2.82 kPa (WSCV, 9.29%) after removing four outliers from the first measurement session.
Extensive research has been performed in clinical practice to obtain accurate and reliable SWE data, revealing that many technical factors, including measurement depth, ROI location and selection, number of measurements, and patient position and respiration, can a?ect the results of ultrasound elastography [29]. The WFUMB guidelines advised that variability can be decreased by using SOPs and implementing a learning curve through suitable training and experience [8,9].
In our preclinical study, we standardized the SWE method as follows: the measurement depth was approximately 1 cm below the probe surface, ROIs were selected from areas with homogeneous color on the speed map of the left liver, and measurements were performed at least eight times. In rats, the subcostal approach to the left lobe is the best way to achieve a good sonic window of the liver. However, the subcostal approach is sensitive to compression of the liver by the probe [30]. Thus, we placed the ultrasonographic probe very carefully to avoid pressure.
Despite these efforts, there were four outliers in the first measurement session. When we reviewed the outliers, the ROIs had been placed in areas where the speed maps showed a heterogeneous color map with several non-filling pixels, indicative of invalid shear wave characteristics. We learned that making measurements in areas with visible homogeneity within the ROIs on images with a good sonic window may improve artifactual and technical sources of variation [31]. In the second session, the radiographer’s skill might have improved in terms of obtaining good sonic windows, selecting sampling boxes, and placing ROIs in the areas of greatest shear wave uniformity. Based on our experience, the training effect might be summarized as adherence to the protocol [32].
In our study, the test-retest repeatability of liver stiffness measurements on SWE was generally good because a well-trained operator measured the same rats twice at a 3-day interval following a trial-specific standardized protocol. The repeatability might be worse in routine preclinical trials that monitor drug efficacy once every few weeks or months. Training might be necessary before each measurement session to minimize intra-operator variability.
In our experiment, the areas of collagen observed in histopathologic examinations were significantly different between the high-dose group (24.86%±4.55%) and the low-dose group (16.01%±3.25%), whereas liver stiffness measurements were not significantly different between the high-dose group and low-dose group. We postulate that quantitative histologic measurements of collagen area might be more sensitive than SWE as a way to quantify liver fibrosis. The histologic measurements used five representative hotspots with substantial areas of Masson trichrome staining, whereas SWE measurements were made in areas with shear wave uniformity. Discrepancies between histologically observed liver fibrosis and liver stiffness measurements have been also reported in prior research. Georges et al. [33] reported that the liver stiffness increased marginally in the late treatment period starting on the 11th day after the start of fibrosis-inducing treatment, while the amount of liver fibrosis grew substantially. Indeed, the degree of correlation between areas of collagen and liver stiffness on SWE was moderate (r=0.6) in our study, similarly to prior animal studies [34,35]. Wang et al. [34] reported a correlation of r2=0.43 (equivalent to r=0.65) and attributed the discrepancies to differences in the liver locations where the histologic analysis and SWE were performed.
There are several limitations in our study. First, we did not measure long-term repeatability, because the liver fibrosis may change in the long term. Second, our test-retest repeatability results at a 3-day interval might be underestimated compared to those of same-day repeatability. The reason why we chose a 3-day interval between the two measurement sessions was that we aimed to include the entire measurement process, including animal preparation, anesthesia, and SWE examination. If we had evaluated same-day repeatability while maintaining anesthesia, we could not have evaluated the impact of animal preparation and anesthesia. Third, the severity of liver fibrosis may change during a 3-day period. However, we believe that such changes were likely very minimal, because we discontinued administration of TAA during the 3-day interval. In addition, we believe that a 3-day interval is appropriate to minimize futile animal loss. In studies where experiments are conducted at 1-day or 2-day intervals, the rats might be distressed due to repeated anesthesia in such a short time. Lastly, our study only evaluated intra-reader variability with an experienced radiographer. However, we have provided data on inter-reader variability obtained from our preliminary experiment in Supplementary Data 2.
In conclusion, in a preclinical trial with an animal liver fibrosis model, the feasibility of using ultrasonographic SWE to evaluate histopathologic liver fibrosis in a non-invasive and repeatable manner was confirmed. The operator’s experience and training in how to adhere to the SOPs might contribute to reducing the variability of liver stiffness measurements on SWE.

 Download Citation
 PDF Links
 PubReader
 ePub Link
 Full text via DOI
 Full text via PMC


