

 Print
Print facebook
 twitter
 Linkedin
 google+

Introduction
Medical ultrasound imaging is widely used to diagnose lesions, but its lower resolution than that of X-ray or magnetic resonance (MR) imaging is a problem to overcome. A medical ultrasound imaging system consists of a multichannel transceiver system using an array transducer [1]. Receive focusing reinforces the signal amplitude by compensating for the difference in arrival time depending on the distance of the array receiving elements from an imaging point. However, since the transmit and receive array transducer is finite in width, it is not possible to completely remove signals from outside the imaging point during focusing, and these signals manifest as side lobes in the constructed image. In particular, side lobes reduce image contrast, thereby making it difficult to detect low-contrast lesions. Therefore, it is necessary to improve the image quality by reducing the adverse effects of side lobes through the application of various signal processing methods in the focusing process.
Apodization is one of the most widely used methods for reducing side lobes in an ultrasound focusing system [2,3]. This method reduces side lobe levels by multiplying signals in the transmit and receive channels by weights, but decreases the resolution by increasing the main lobe width. Minimum variance beamforming (MVB) methods [4-9] compute and apply a set of optimal apodization weights for each imaging point. Inherently requiring a high computational complexity, they have been widely used for underwater sonar and radar imaging because they can significantly improve image resolution. Recently, extensive research has investigated the application of these methods in ultrasonic imaging. Although the resolution may be enhanced, the resulting speckle pattern tends to be distorted and different from that of delay and sum (DAS) beamformed images, which are the typical B-mode images available in every diagnostic ultrasound scanner [9]. Therefore, it is necessary to adjust the parameters necessary for MVB calculation to obtain satisfactory image quality [9]. The receive channel data coming from the direction of the side lobe have different spatial frequencies depending on the incident angle. Therefore, side lobe suppression filters can be used to estimate the side lobe levels at imaging points based on the spatial frequency characteristic [10-13].
The main and side lobe signals in actual ultrasound data acquired from the human body cannot be precisely separated by signal processing. In this paper, we propose a method of synthesizing a side lobe-free image by computer simulation and using it as a ground truth image to compare with side lobe-filtered images. In order to construct a side lobe-free image, we synthesized a point target image, a cyst image, and a pseudo in vivo image by computer simulation. The side lobe-free image was synthesized using only the signal from the main lobe, without any side lobe at all, in the focusing process, and was used as a ground truth to compare image quality [13]. To synthesize a pseudo in vivo image, we used the gray pixel values of an MR image of the kidney as representing the reflectivity of a cloud of ultrasonic scatterers to generate ultrasound echo data reflected from the human body and then synthesized conventional, side lobe, and main lobe images [13,14]. The main lobe image was an ideal image, with no side lobe at all. By improving the quality of ultrasonic medical images using three different methods-apodization windowing, side lobe estimation and reduction (EAR) filter, and MVB-and comparing the results with the main lobe image (i.e., the side lobe-free ideal image), we confirmed the usefulness of such signal processing methods in improving medical ultrasound image quality.
Materials and Methods
Point Spread Function
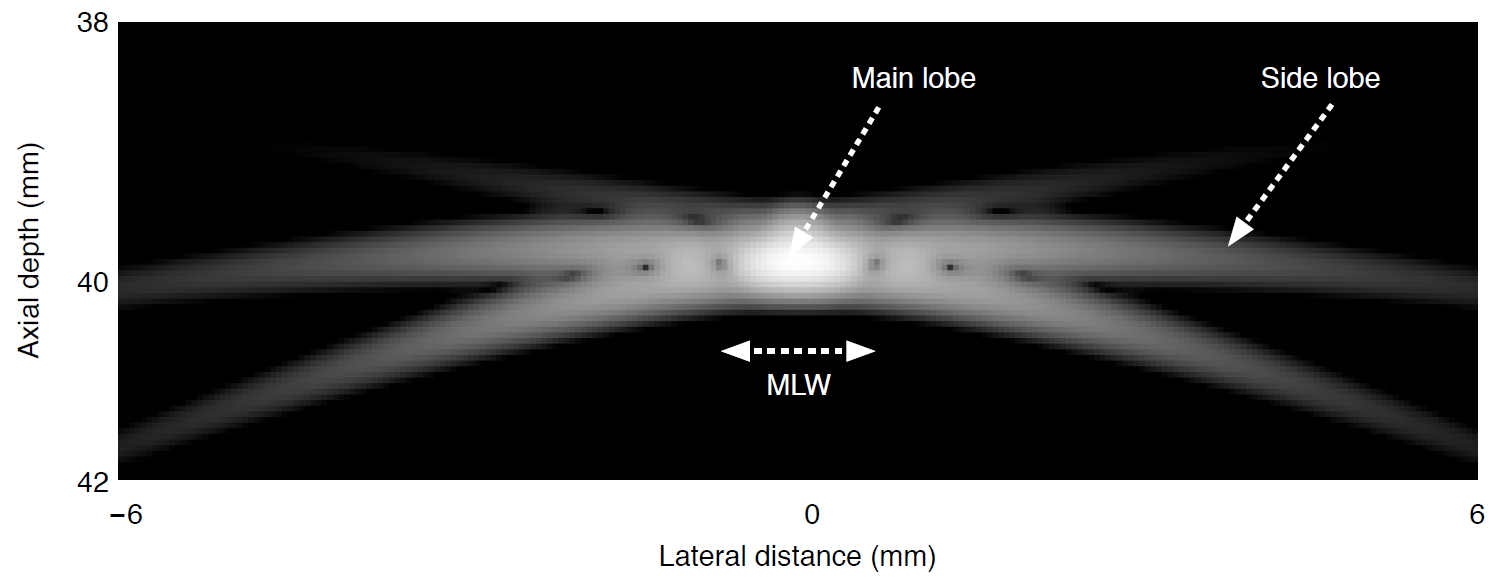
A point target is imaged by a medical ultrasound imaging system to evaluate its image quality. The resulting image, referred to as a point spread function (PSF), can be used to characterize the imaging system in question. In order to observe the characteristics of the main and side lobes, we modeled and carried out computer simulations of an ultrasound focusing system where 64 channels were used on transmit and receive, the transmit focal depth was set to 30 mm, the transducer center frequency was 5 MHz, the element width was one wavelength, and the speed of sound was 1,500 m/s. We constructed an image of the point target at a depth of 40 mm and logarithmically compressed it over a dynamic range of 60 dB to be able to better observe the side lobes present in the image. In the center of Fig. 1, the brightest area, with a main lobe width of 1.2 mm, is the main lobe. The main lobe region is where the actual point target appears in the image, and the better the focusing performance, the smaller the main lobe region. The wingshaped bright area outside the main lobe region represents the side lobes and corresponds to noise. The side lobes arise due to the fact that the signal from scatterers outside the main lobe region is not completely canceled out in the focusing process. If a scatterer with small reflectivity, such that its echo is smaller than the magnitude of a side lobe signal, is present in an area where the side lobe appears, it appears as a small main lobe signal and cannot be observed in the image. Since the side lobe level is proportional to the main lobe level, large side lobes always appear around a strong scatterer. This makes it difficult to observe the inside of a low-reflectivity cyst.
Side Lobe-Free Imaging
Ultrasound echo signals reflected from the tissue of the human body are received as a superposition of signals from the main lobe region and clutter or side lobe signals from the other region. Therefore, dynamic receive focusing and various signal processing techniques are employed to reduce side lobes, thereby improving the image quality. However, since the magnitude of the side lobe signal in the ultrasound echo signal cannot be accurately estimated, the effect of the side lobe on the image cannot be precisely determined.
In order to solve this problem, we reported a method for separating the main and side lobe signals in the process of synthesizing ultrasound signals by computer simulation, and quantitatively calculated the magnitude of the side lobes in the image [13]. In a computer simulation, ultrasound echo signals from the human body are generated by modeling the body as consisting of a large number of scatterers with nonuniform reflection coefficients, which are distributed over a wide area. Since the position and reflectivity of the scatterers in a simulated human phantom are known in advance, the signal from each scatterer can be identified on receive, and, therefore, the main and the side lobe signal can be separated so that a side lobe-free image can be synthesized only from the main lobe without the side lobe. Since the side lobe-free image has the maximum possible resolution and contrast that an ultrasound imaging system can achieve under a given set of conditions, it can be used as a ground truth image in a simulation where ultrasound image signal processing is used to improve the image quality. The proposed method cannot be applied to actual human body data, but the effect of the side lobe on image quality can be theoretically explored by a computer simulation.
Apodization
Multiplying each channel signal by a window function in the focusing process of the received ultrasound signal reduces the side lobe levels by suppressing the high spatial frequency components of the side lobe. This signal processing is called apodization. A general DAS beamformer performs dynamic receive beamforming that can be expressed as
where ch is the channel index, N is the total number of channels used, xch[n] is the received radiofrequency echo signal of the chth channel, n is the time index, Ōłåm[n] is the dynamic receive focusing delay, wch[n] is the apodization weighting, and z[n] is the beamformer output. In this study, the Hamming function was used as an apodization window to reduce side lobe levels [2,3].
Side Lobe EAR Filter
If the magnitude of the side lobe signal can be estimated in the focusing process of the ultrasonic signal, it can be used in the signal processing task for reducing the side lobe. The side lobe can be modeled as sinusoids of different spatial frequencies depending on the angle of incidence in the receive channels. Therefore, it is possible to estimate the magnitude of the side lobe by decomposing the received channel signal into spatial frequency components using the Fourier transform and separating out only the side lobe component [10]. A side lobe suppression filter using the magnitude of the side lobe estimated from an imaging point has been reported [12]; this is referred to as the side lobe EAR filter and is defined as follows:
where Bpixel is the brightness of an imaging point, Bfiltered is the brightness of the filter output, QF is the side lobe level of a pixel, and ╬│ is a scale factor (i.e., an experimentally determined parameter that controls the filter performance). The side lobe EAR filter first estimates and then subtracts the side lobes at an imaging point and operates to reduce the output brightness when the estimated side lobe levels are large.
Minimum Variance Beamforming
MVB is a method of calculating and applying an optimized apodization window W[n] at all imaging points, which minimizes the variance of z[n] in Eq. (1), subject to the constraint that the gain in the desired beam direction equals unity. The apodization window can be found as
Results
We constructed conventional, main lobe, and side lobe images of point targets, cysts, and a pseudo-human kidney by computer simulation, and used the main lobe image as a ground truth image to compare the images obtained by applying three types of signal processing to suppress the side lobe.
Imaging of Point Targets
A point target image can best represent the focusing performance of a medical ultrasound imaging system. In the point target image, the characteristics of the main lobe and the magnitude and distribution of the side lobe determine the resolution and contrast, respectively. The effect of side lobe suppression can be readily seen in the point target image because the main and the side lobe each occupy distinct different image regions. A computer simulation of the point target image was conducted to observe the effects of the side lobe, as well as side lobe suppression filtering.
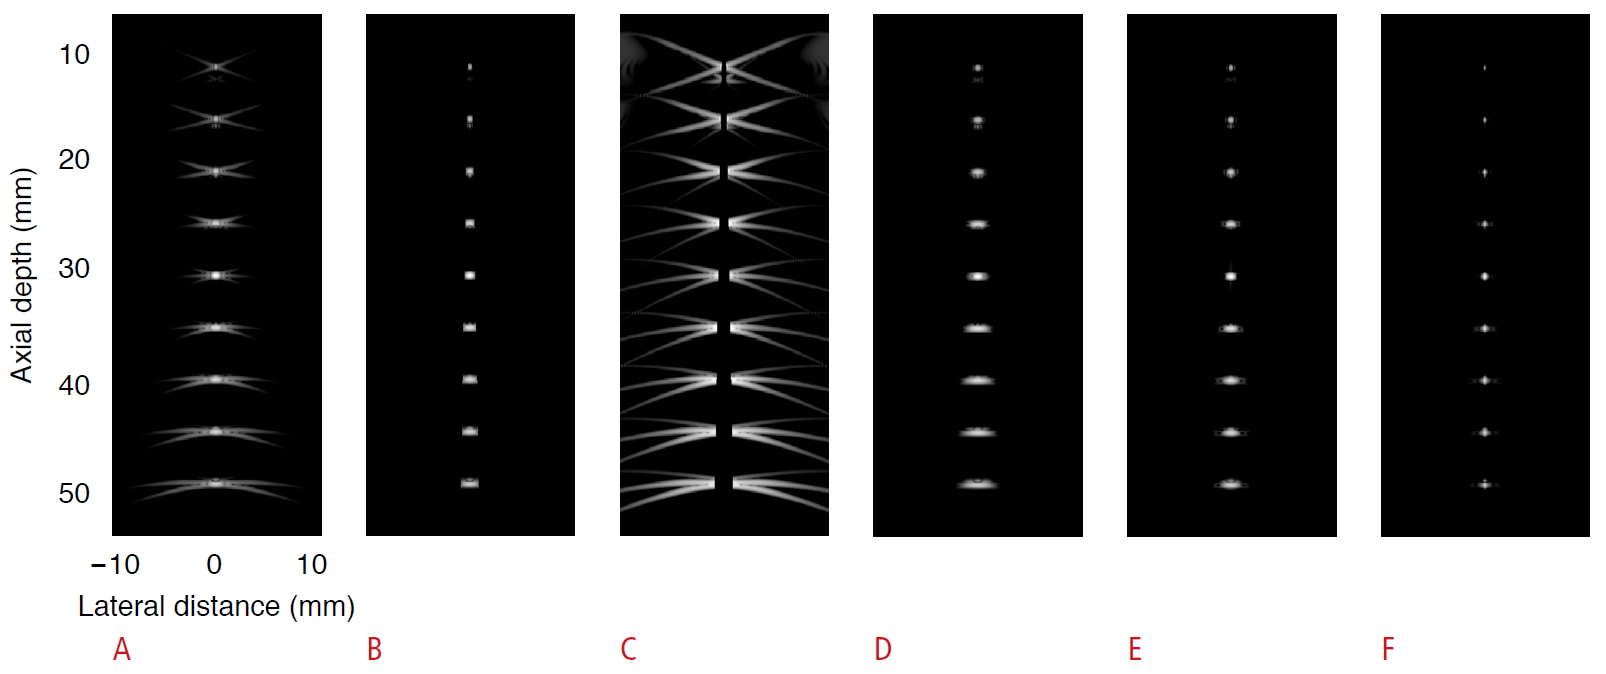
The computer simulation conditions were the same as in the previous PSF computation. An array of nine-point targets were placed at intervals of 5 mm over a depth from 10 to 50 mm. The simulation program was written in MATLAB and executed on an IBM PC. Logarithmic compression was performed over a dynamic range of 60 dB to reveal the details of the side lobe in the image. Fig. 2A shows the PSF of conventional imaging, in which receive dynamic focusing was employed and the transmit focal depth was set to 30 mm. Fig. 2B and C are, respectively, the main and the side lobe image constructed by separately extracting the main and side lobe signals from Fig. 2A. Since the regions in which the main and side lobes are present do not overlap, the two lobes can be easily distinguished from each other. As a result of the logarithmic compression of the side lobe image alone in Fig. 2C, the side lobes appear over a large area because smaller side lobes are amplified. Fig. 2D shows the result of applying Hamming apodization to the receive focusing process to reduce the side lobe. The side lobe level is lower, but the width of the main lobe is greater, resulting in lower resolution. We applied signal processing methods such as side lobe EAR filtering and MVB. Fig. 2E shows the side lobe EAR-filtered image with a scale factor of 2. Fig. 2F shows the result of applying MVB with the spatial smoothing, temporal averaging, and diagonal loading factors of 64, 1, and 0.05, respectively. In side lobe suppression filtering, it can be seen that the side lobe could be reduced without degrading the main lobe characteristics. For the point target, the resolution and the degree of side lobe reduction turned out to be most pronounced for the MVB method. The main lobe image presented in Fig. 2B is not only useful from the standpoint of quantitative evaluation, but also can be used as a ground truth image for comparison with other images.
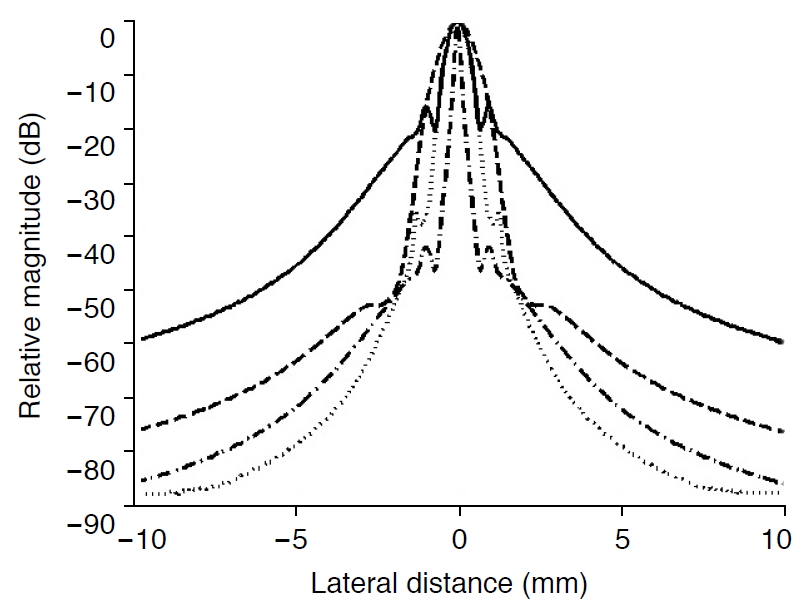
Fig. 3 compares the lateral field responses of the point target at a depth of 40 mm in the point target image. The solid line is the ultrasound field of the conventional image obtained using only DAS beamforming. The width of the main lobe is narrowest to achieve the best resolution, but the side lobe levels are high. The magnitude of the first side lobe is 15.9 dB lower than that of the main lobe when using a linear array transducer. As one of the most widely used signal processing methods for side lobe reduction, the Hamming apodization (dashed line) is effective in decreasing the side lobe levels below -52.8 dB, but increases the width of the main lobe. The side lobe EAR filtering (dotted line) and MVB (dash-dotted line) methods suppress the side lobe levels without increasing the width of the main lobe. Both methods require a large amount of computation, but produce better results than the apodization method. The lower side lobe levels indicate that the image contrast is increased and that lesions in the area with a smaller brightness difference can be better differentiated.
Imaging of Cysts
In ultrasound images, lesions such as tumors or cancers appear darker or brighter than the surrounding tissues. For a hypoechoic cyst in homogeneous soft tissue, the cyst boundary tends to look blurry and the contrast inside the cyst is lowered because side lobes infiltrate the cyst. Computer simulations of hypoechoic cyst images were performed to compare the image contrast. We randomly distributed a cloud of scatterers in the background so that the speckle pattern could be fully developed. Six cysts with a diameter of 4 mm were placed in the lateral direction at a depth of 35 mm with reflectivity of, from left to right, -30 dB, -24 dB, -18 dB, -12 dB, -6 dB, and +6 dB relative to that of the background. In addition, for the purposes of comparison, three point targets with reflectivity of 24 dB, 30 dB, and 36 dB higher than that of the background were placed in the axial direction at depths of 32 mm, 35 mm, and 38 mm on the left side of the leftmost cyst, respectively. In order to make the generated side lobe level slightly higher for comparison purposes, the transmission focusing depth was set to 50 mm, not 35 mm.
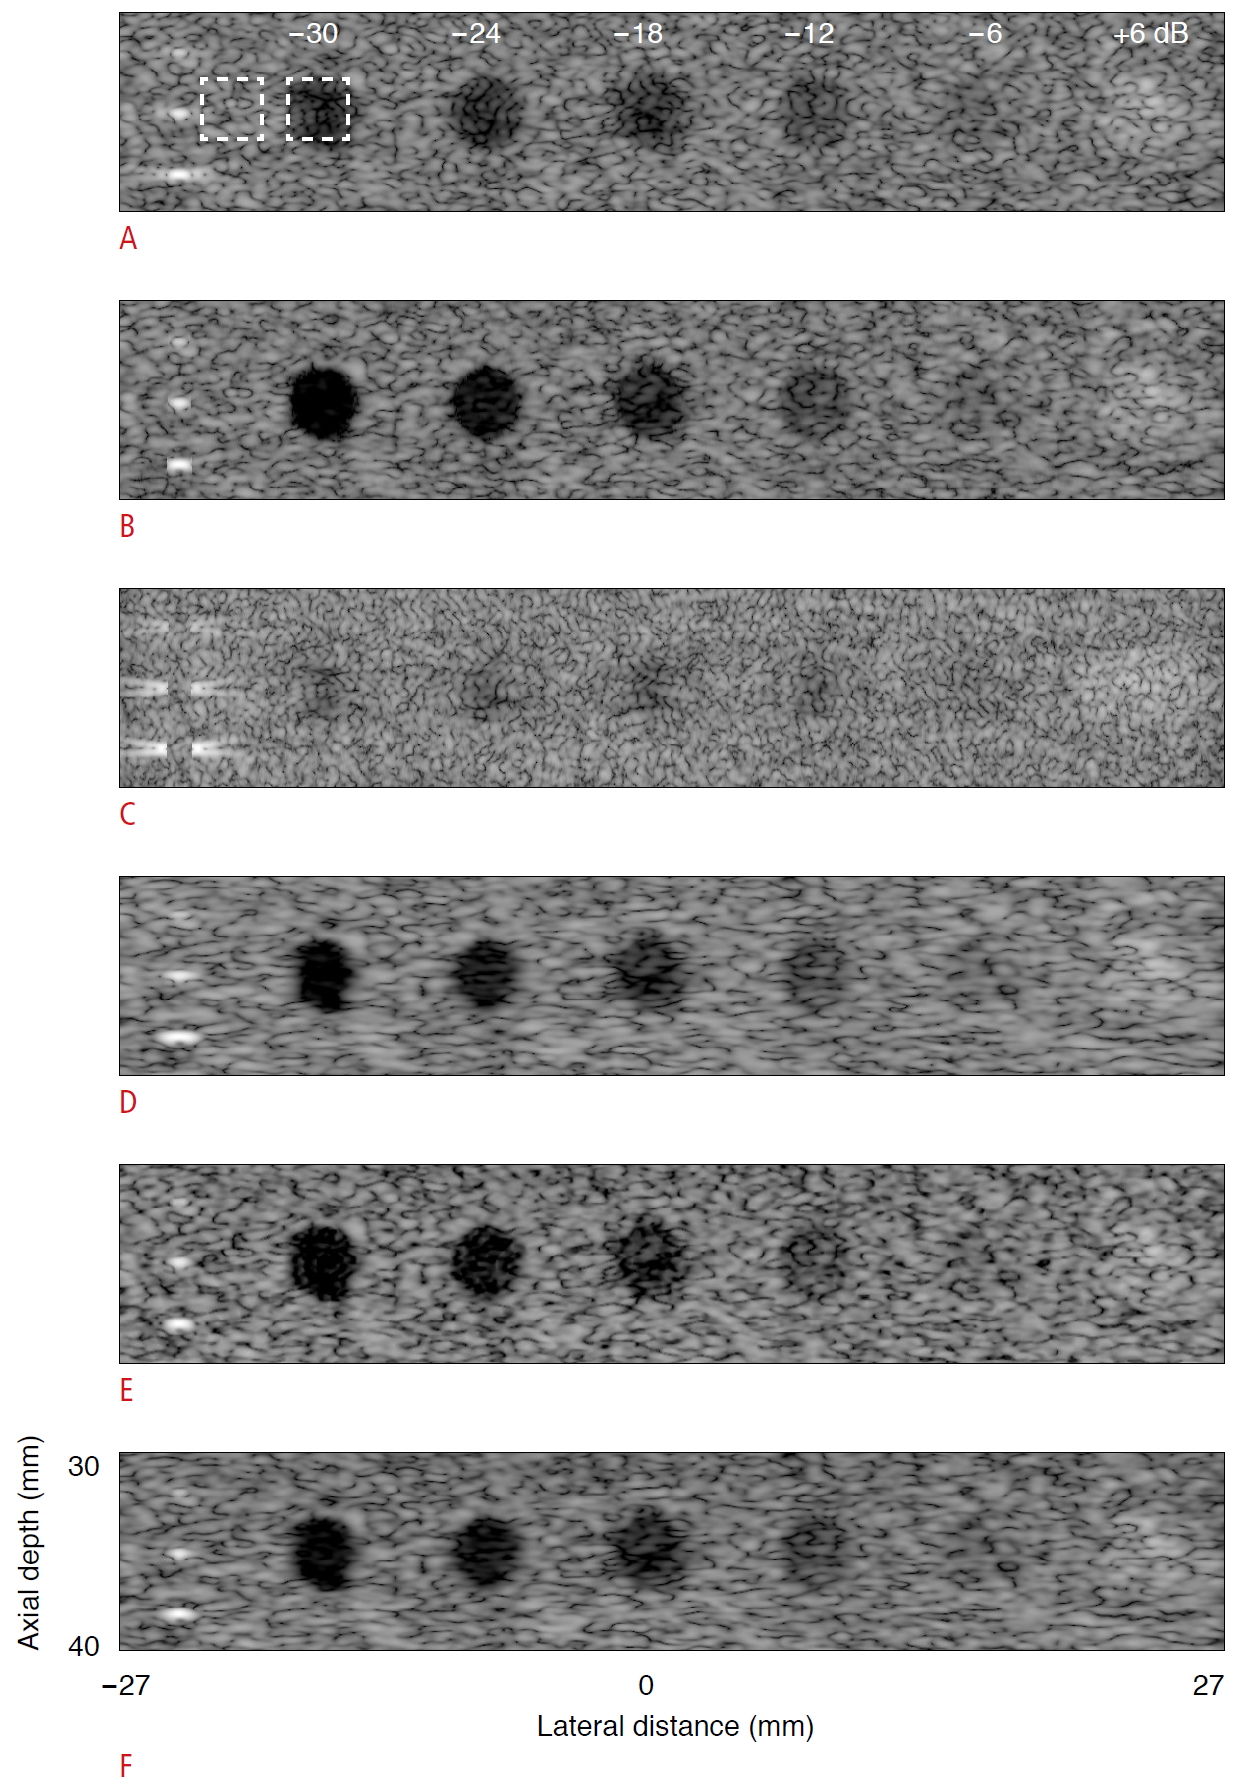
All the images shown in Fig. 4 are of size 10 mm (axial)├Ś54 mm (lateral). Except for the rest, which used 60 dB, Fig. 4E was logarithmically compressed over a dynamic range of 70 dB to make smaller levels more observable. Fig. 4A is the conventional image. Fig. 4B and C are the main and side lobe images, respectively. Fig. 4D is the Hamming apodization image, Fig. 4E is the side lobe EAR-filtered image using a scale factor of 2, and Fig. 4F is the MVB image with spatial smoothing, temporal averaging, and diagonal loading factors of 32, 1, and 0.5, respectively. After side lobe EAR filtering, the brightness of the bright area associated with the main lobe was maintained, but that of the area associated with the side lobe became dark, with the result that the entire image became dark and that the speckle pattern tended to be different from that of the conventional image [4,9]. To cope with this phenomenon, the parameters of the side lobe EAR filter were adjusted so that the speckle pattern was similar to that of the conventional image. In addition, to make the brightness of all the images similar, the logarithmic compression was appropriately adjusted.
In the main lobe image, which is completely devoid of side lobe, the boundaries of the cysts are more pronounced, and the difference in contrast between the cysts is more conspicuous.
In the conventional image, the difference in speckle brightness inside the cysts is not large. This is because when the side lobe generated in the background of the cyst boundary is larger than the reflected signal from the inside of the cyst, the former masks the latter. When the reflectivity inside the cyst is small and the magnitude of the side lobe in the surrounding region is large, it is difficult to decide whether the cyst is present or not. For the cysts of reflectivity -30 dB, -24 dB, and -18 dB in Fig. 4A, the small difference in brightness between them can be attributed to the fact that in conventional DAS beamforming the side lobe level is 15.9 dB less than the main lobe peak level. When Hamming apodization is applied, the side lobe inside the cyst is suppressed. As the main lobe width increases, the lateral resolution decreases, and the cyst boundary appears to be shrunk toward the inside of the cyst.
In the side lobe EAR filter and MVB, the cyst boundary became more pronounced as a result of the side lobe being suppressed, and the difference in contrast between the cysts can be well identified.
To evaluate the speckle brightness contrast between the background and the cyst, we computed the contrast ratio (CR), which is defined as follows [15]:
where Sc is the average brightness inside the cyst and Sb is the average brightness in the background. For the -30 dB cyst, the two areas selected for the calculation are represented by the two dotted square boxes in Fig. 4A. The same windows were used for the remaining other cysts as well.
Table 1 compares the computed CR values of cysts. The CR difference between the cysts in the main lobe image is evident, but does not increase linearly because the logarithmic compression used in the image processing is a nonlinear operation. The logarithmic compression reduces the brightness contrast as the image becomes brighter. In conventional imaging, the CR does not decrease proportionally even if the reflectivity decreases because of the effect of the side lobe in the vicinity of the cyst. It can be seen that the contrast between the cysts increased in both examples of side lobe suppression filtering (i.e., side lobe EAR filtering and MVB). The Hamming apodized image has the best contrast, but there is still room for improvement compared with the CR value of the main lobe image. The MVB image performs best for point targets, but less so for speckle objects.
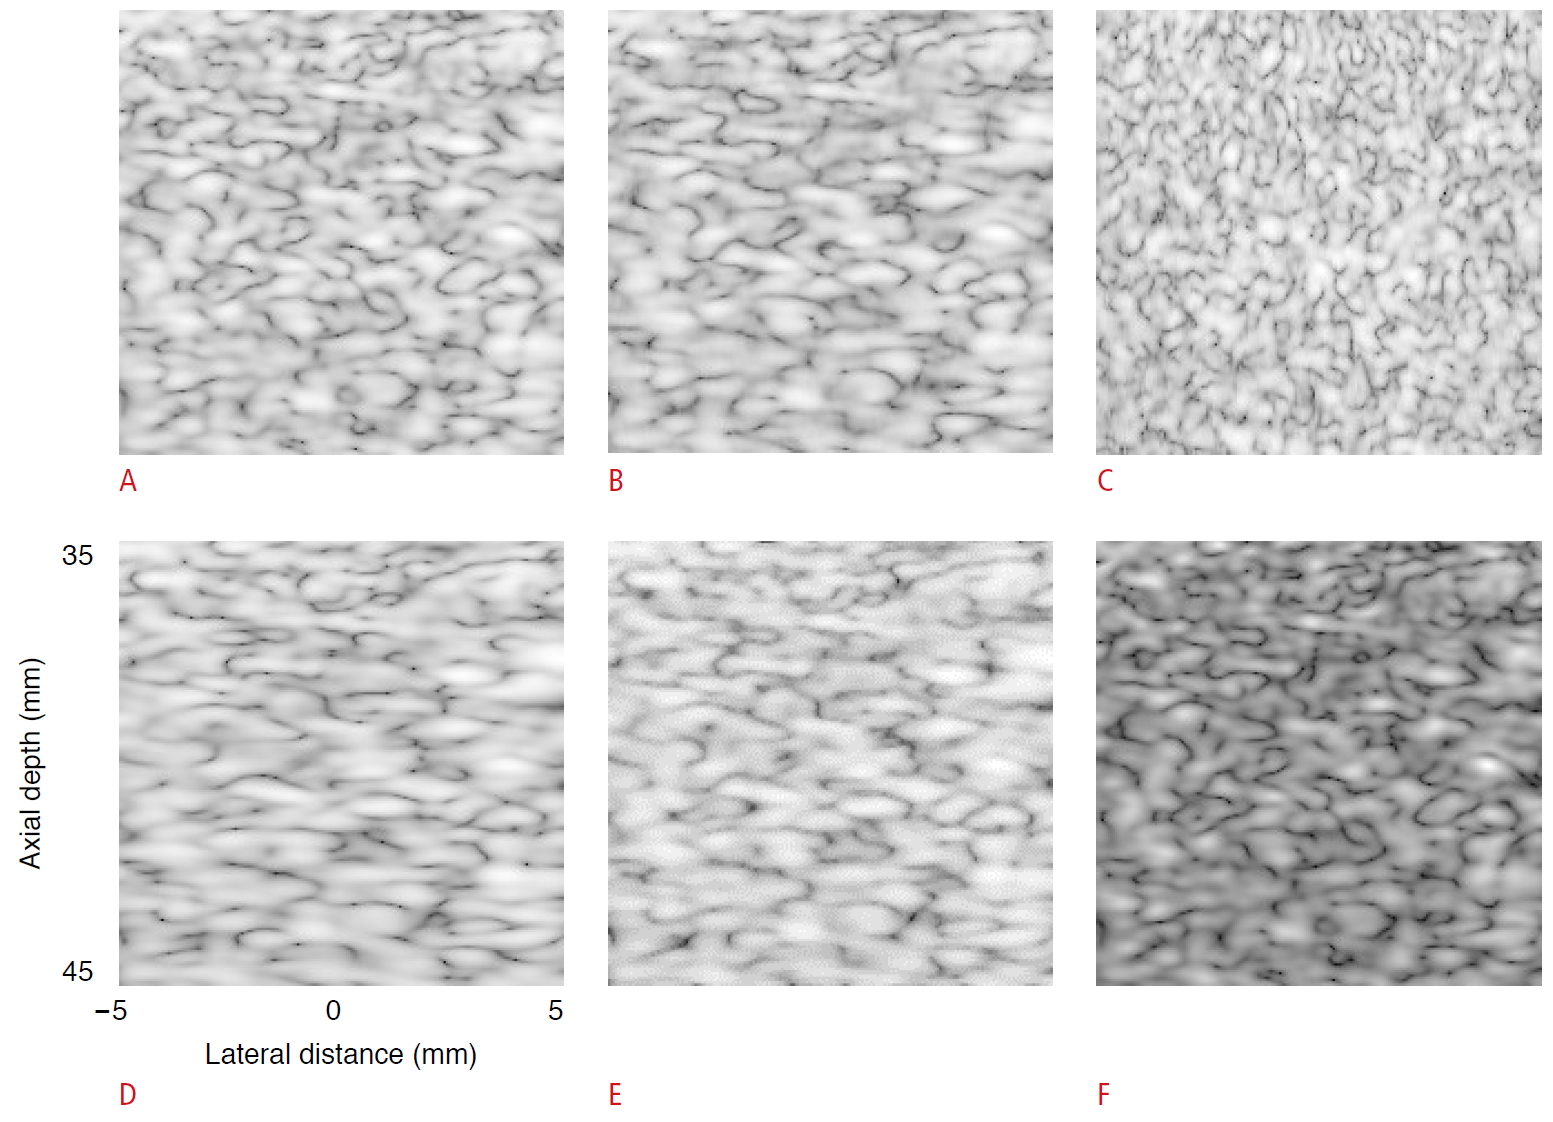
Fig. 5 compares the changes in speckle pattern due to the side lobe suppression filtering. We can see that both the conventional and main lobe images have the same speckle pattern. In the conventional image (Fig. 5A), since the magnitude of the side lobe is smaller than that of the main lobe by 15.9 dB, the side lobes are swamped by the main lobe signal in the speckle region comprised of random scatterers. In the speckle pattern of the side lobe image (Fig. 5C), the spatial frequency of the lateral side lobe is higher than in the main lobe image (Fig. 5B), and the side lobe signal corresponds to the fine pattern in the image. The Hamming apodization image (Fig. 5D) has a lower lateral resolution with a speckle pattern elongated in the lateral direction. For side lobe EAR filtering, the parameters were tuned such that the speckle pattern was similar to that of the conventional image. The speckle pattern of Fig. 5E turned out to be very different from that of the conventional image (Fig. 5A) when the parameters of the side lobe EAR filter were adjusted to increase the image resolution [12,13]. In particular, the MVB method with the spatial smoothing, temporal averaging, and diagonal loading factors of 64, 1, and 0.001, respectively, maintained nearly the same brightness of the bright area of Fig. 5F but rendered its dark area as much darker. It can be seen in Fig. 5 that speckle characteristics changed only slightly from one signal processing method to another and that the image quality degradation due to the side lobe can hardly be noticed. Moreover, it can be noted that the side lobe suppression methods cannot improve both resolution and contrast simultaneously in the speckle-only region.
Comparison of Resolution in Simulated Human Images
In order to observe the effect of the side lobe in ultrasound images of the human body, pseudo-ultrasonic signals were synthesized using a computer. Since actual ultrasound data obtained from the human body cannot be used to synthesize a side lobe-free image, ultrasound images were synthesized from a distribution of scatterers, the reflectivity of which was obtained from converting the gray levels of an MR image of the human kidney [16]. We simulated a 64-channel system using a 3.5-MHz linear array transducer. The element pitch was one wavelength, and the transmit focal depth was at 80 mm. Starting from a depth of 40 mm, the image size was 117 mm (axial)├Ś130 mm (lateral). The size of the kidney in the synthesized ultrasound image does not match that of the human kidney. Fig. 6A and B show an MR image of the human kidney and its gray level distribution converted into the ultrasonic reflectivity coefficient, respectively.
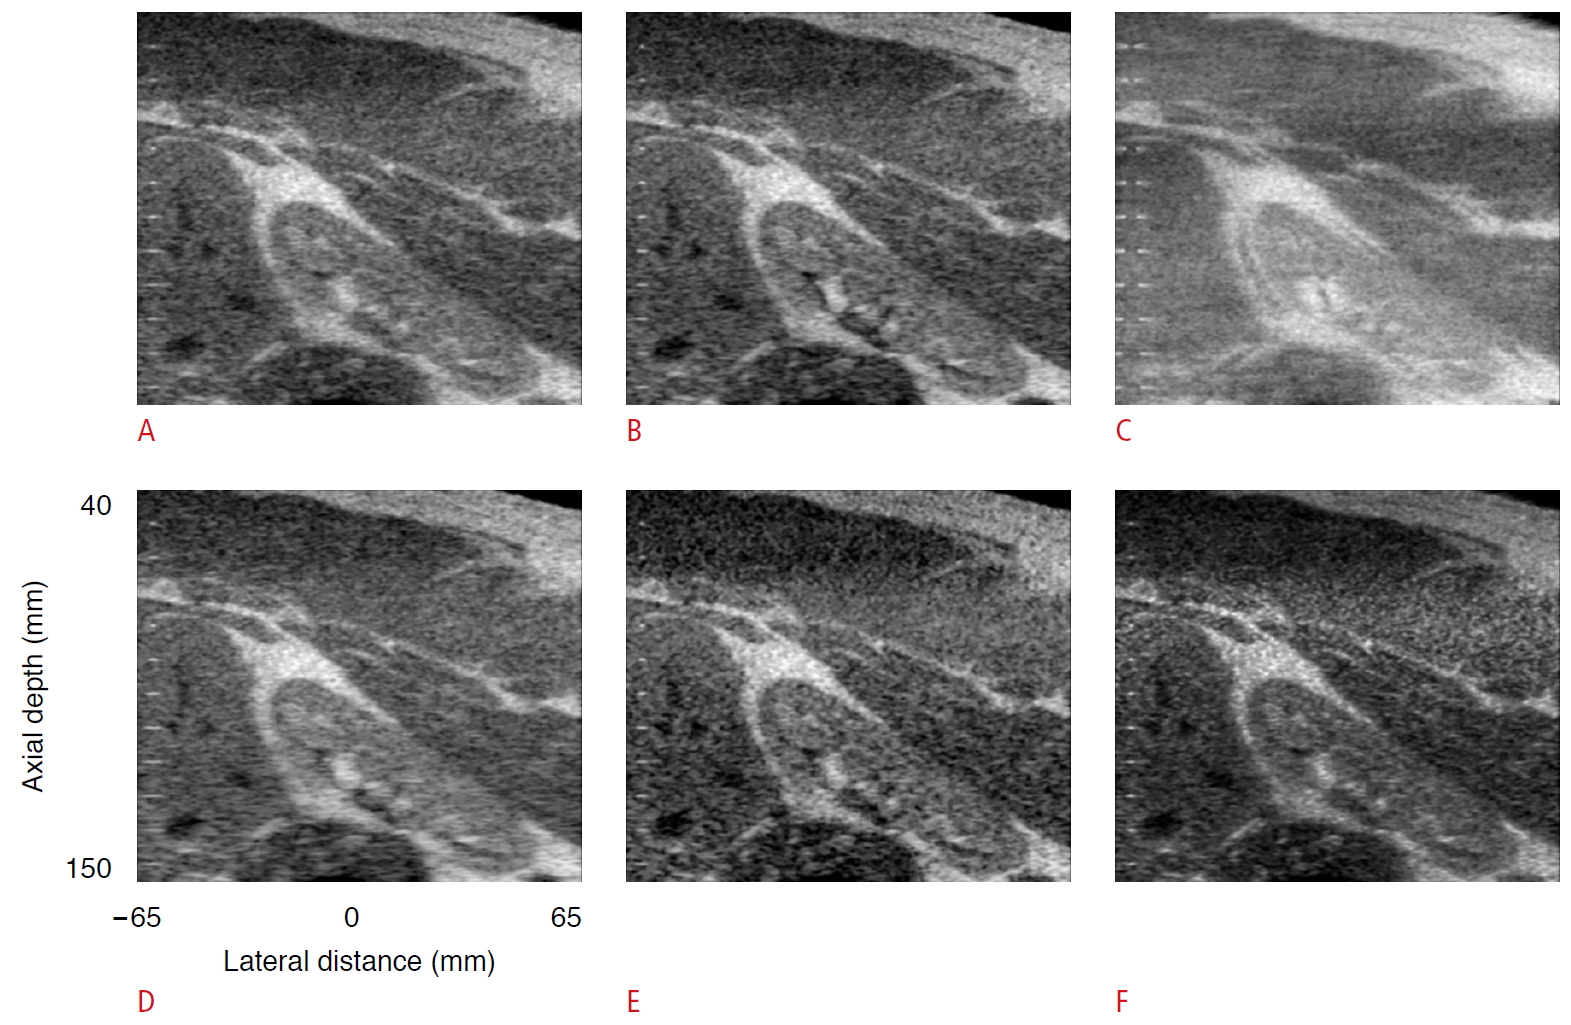
Fig. 7 shows computer-synthesized in vivo ultrasound B-mode images starting with the gray level MR image of the kidney, where Fig. 7A is the conventional image, Fig. 7B is the main lobe image, Fig. 7C is the side lobe image, Fig. 7D is the Hamming apodization image, Fig. 7E is the side lobe EAR-filtered image with a scale factor of 5, and Fig. 7F is the MVB image with the spatial smoothing, temporal averaging, and diagonal loading factors of 64, 1, and 0.01, respectively, and 90 dB of logarithmic compression to match the brightness of the other images with 60 dB of logarithmic compression. In order to check the image resolution, point targets were arranged at 5-mm intervals in the axial direction on the left side of the images. In the main lobe image (Fig. 7B), the fine tissue inside the kidney can be differentiated. In the side lobe image (Fig. 7C), the side lobe appears in the lateral direction at the boundary of the region with a large reflectivity. In the case of Hamming apodization (Fig. 7D), the resolution is lower, but the contrast is higher. Although the main lobe width is higher and thus the resolution is lower, suppression of the side lobes may well compensate for this disadvantage by providing an improved basis for making a diagnosis. In the side lobe EAR filtering (Fig. 7E) and MVB (Fig. 7F), the side lobe levels of the left array of point targets are lower, and the resolution is clearly better than that of the conventional image (Fig. 7A).
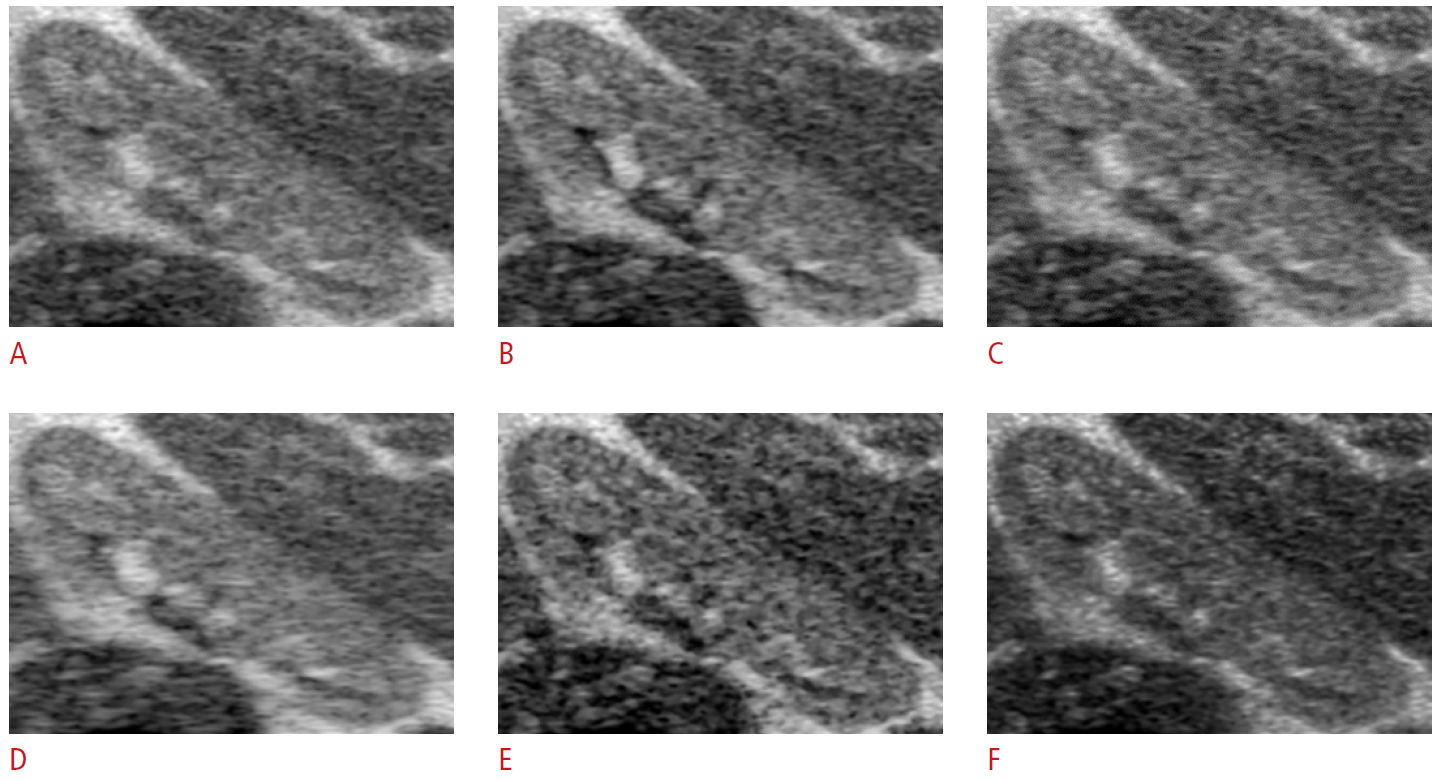
Fig. 8 zooms in on a part of the kidney to check the image resolution, where Fig. 8A is the conventional image, Fig. 8B is the main lobe image, Fig. 8C is the compound image, Fig. 8D is the Hamming apodization image, Fig. 8E is the side lobe EAR-filtered image, and Fig. 8F is the MVB image with spatial smoothing, temporal averaging, and diagonal loading factors of 64, 1, and 0.01, respectively. Ultrasound images that have not undergone postprocessing tend to have black spots. Since those specks appear coarse when zoomed in on, they were removed by median and lowpass filtering. Compared with the conventional image (Fig. 8A), the contrast of the kidney is highest in the main lobe image. Fig. 8D, E, and F have better resolution and contrast than Fig. 8A. The MVB image in Fig. 8F appears darker than other images since the brightness of the speckle regions is lower when both strong reflectors and speckle regions are present, so a logarithmic compression of 90 dB was applied to make the brightness similar to that of other images. The improvement of the MVB filtered image quality varies from one region to another depending on the anatomical structure. Accordingly, there is a need to adjust the parameters of MVB to suit the imaging characteristics of the region to be imaged for diagnosis.
In order to reduce image noise and improve resolution in ultrasound image signal processing, the compound imaging technique that averages images processed using different signal processing methods is widely used [17,18]. Fig. 8D, E, and F present the images obtained by applying different signal processing techniques to ultrasound data obtained from the human kidney. The compound image (Fig. 8C) obtained by superimposing Fig. 8D, E, and F is more similar to the main lobe image than any of Fig. 8D, E, and F in isolation.
Discussion
This paper presents a method of generating a ground truth image that can be used to evaluate the performance of signal processing methods for improving image quality in medical ultrasound imaging. In a point target image, the main and side lobe characteristics determine the image resolution and contrast, respectively. Since echoes from the main and lobe side regions are superposed together, those due only to side lobes cannot be quantitatively determined. As a result, the performance of side lobe suppressing filters cannot be quantitatively evaluated in terms of side lobe levels, which themselves cannot be exactly identified.
In this study we were able to separate the main and side lobe echo parts and construct the main and side lobe images by computer simulation. In this way, side lobe levels can be quantitatively measured and used to improve the performance of side lobe suppression filters by applying the side lobe EAR filtering (Eq. 2). We also showed that the main lobe image can be used as a ground truth image for reference when evaluating the performance of side lobe suppression filters, since the main lobe image has no side lobes at all. In particular, for in vivo imaging, it is not possible to construct a side lobe-free image. Therefore, starting with an MR image of the human kidney, we theoretically computed and separately constructed the main and side lobe images, in which the former represented the ground truth image, and showed that it is feasible to evaluate the performance of several signal processing methods such as apodization, the side lobe EAR filter, and MVB.
Our proposed method of evaluating signal processing methods can be summarized as follows. We synthesized an ultrasound image with similar characteristics to an in vivo acquired image, for application in signal processing. In the synthesis process, the main lobe, side lobe, and conventional images were separately constructed. The main lobe image was free from noise, and was selected as a ground truth image to compare with the images resulting from signal processing. The side lobe image accounted for the noise component of the conventional image. Signal processing was applied to the conventional image to produce the subsequent improved image, which was then compared with the main lobe (i.e., ground truth) image, making it feasible to evaluate the characteristics of image quality improvement. Before applying signal processing filters, a set of optimum filtering parameters that have been determined from the simulated images can be employed in an actual in vivo imaging scenario, paving the way for image quality improvement.
In this paper, based on the criterion of the ground truth image, we investigated the effect of the side lobe on medical ultrasound images by applying side lobe suppression filtering. Despite the drawback of decreased resolution, the commonly used apodization method increases the contrast, which improves image quality and enables a better diagnosis. Although the side lobe EAR filter and MVB are demanding in terms of computation, the image can be greatly improved. In particular, the diagnosis of an internal hypoechoic cyst with a low reflectivity requires the use of signal processing. Compounding of images processed by various signal processing methods increases the resolution and contrast, while reducing the speckle noise. It should be noted that various parameters, including the scaling, spatial smoothing, temporal averaging, and diagonal loading factors, were determined in a manner appropriate for comparing images.
In particular, the development of real-time digital signal processing and graphics processing unit computing techniques has enabled real-time implementation of various signal processing algorithms and techniques, even with high computational complexity. The real-time capability of medical ultrasound imaging and the fact that medical ultrasound images can be improved by adjusting in real time parameters that control the characteristics of the side lobe suppression filtering are expected to greatly aid in the fast and accurate diagnosis of lesions.

 Download Citation
 PDF Links
 PubReader
 ePub Link
 Full text via DOI
 Full text via PMC


