Lee, Kim, Kim, Seo, Song, and Lee: Controlled attenuation parameter measured using transient elastography for the noninvasive assessment of macrovesicular steatosis in potential living liver donors

Abstract

Purpose

This study aimed to determine the diagnostic performance of the controlled attenuation parameter (CAP) measured using transient elastography (TE) for assessing macrovesicular steatosis (MaS) in potential living liver donors using same-day biopsy as a reference standard.

Methods

This retrospective study included 204 living liver donor candidates who underwent TE and liver biopsy on the same day between July 2013 and June 2014. The histologic degree of MaS was determined. The area under the receiver operating characteristic curve (AUROC) was used to evaluate the performance of CAP for diagnosing MaS of >10%, and the optimal cutoff value was identified using the maximal Youden index.

Results

Based on liver biopsy, 185 subjects had MaS of ≤10% and 19 had MaS of >10%. The CAP value was significantly correlated with the percentage of MaS on liver biopsy (r=0.635, P<0.001), and the median CAP value was significantly higher in subjects with MaS of >10% than in those with MaS of ≤10% (300 dB/m vs. 209 dB/m, P<0.001). The AUROC for diagnosing MaS of >10% by CAP was 0.938 (95% confidence interval, 0.896 to 0.967), and a CAP of >259 dB/m yielded a sensitivity of 84.2% and a specificity of 92.4%.

Conclusion

The CAP measured using TE was significantly correlated with MaS and accurately detected substantial MaS in potential living liver donors. The CAP is a promising tool for the noninvasive diagnosis of MaS and may be used to screen unsuitable living liver donor candidates.

Introduction

Liver transplantation (LT) is the most effective treatment for end-stage liver disease [1]. Most LT centers in Asia predominantly perform living donor LT (LDLT) due to a shortage of deceased organ donations [2]. However, a rising incidence of nonalcoholic fatty liver disease (NAFLD) in the general population has been reflected in an increasing prevalence of living liver donors with NAFLD [3]. The degree of macrovesicular steatosis (MaS) in donated livers is known to be a critical factor determining outcomes after transplantation. MaS affects the recovery of the remnant liver in living donors as well as graft function in recipients. Therefore, the evaluation of MaS in donated livers is crucial, particularly for LDLT, during which donor safety is a primary concern. Many LDLT centers prefer to accept right liver donors with MaS of up to 10% [4-6]. According to the International Liver Transplant Society guideline on living liver donation, MaS of >10% is considered substantial [7].
Liver biopsy is considered the gold standard for assessing the degree of hepatic steatosis [8]. Although this procedure has a relatively low complication rate in healthy living donors [9], it is an invasive procedure that can lead to morbidity [10]. Therefore, noninvasive methods have been investigated for the evaluation of steatosis. Recently, the controlled attenuation parameter (CAP) measured using transient elastography (TE) has been proposed as a promising noninvasive method for the detection and quantification of hepatic steatosis [11]. The CAP measured using TE has been validated for the assessment of steatosis in patients with chronic liver disease of various etiologies [12], and meta-analyses have shown good diagnostic accuracy of CAP for identifying hepatic steatosis [13-16]. However, only a few studies have investigated the usefulness of CAP for assessing steatosis in potential living liver donors [17,18]. In addition, to the authors’ knowledge, the potential role of CAP in identifying substantial MaS in living liver donor candidates has not yet been evaluated.
Therefore, this study aimed to determine the diagnostic performance of CAP for the assessment of MaS in potential living liver donors using same-day biopsy samples as a reference standard.

Materials and Methods

Compliance with Ethical Standards

The study was approved by the institutional review board of the authors’ institution (IRB approval number: AMC 2021-0378). The requirement for written informed consent was waived due to the retrospective nature of the analysis.

Study Population

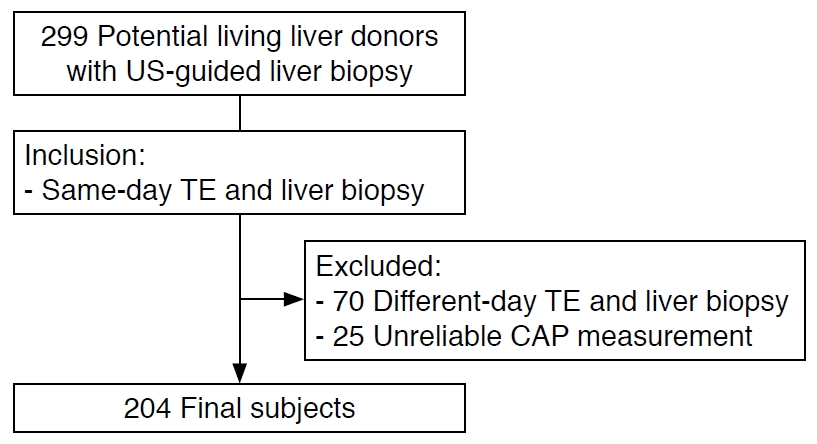
Between July 2013 and June 2014, 299 potential living liver donors underwent ultrasound (US)-guided liver biopsy as part of a routine predonation work-up. Liver biopsy was performed if candidates met the following conditions: (1) no more than 20 g of alcohol consumption per day; (2) no regular drug use including herbal medications; and (3) no serological evidence of hepatitis B, hepatitis C, or human immunodeficiency virus infection. Subjects were considered eligible for inclusion in our study if they were living liver donor candidates who had undergone TE with CAP and liver biopsy on the same day. Donor candidates who had undergone TE and liver biopsy on different days (n=70) or who had unreliable CAP measurements (n=25) were excluded (Fig. 1).

Clinical and Laboratory Data

Demographics (age and sex), anthropometric measurements (body weight and height), and laboratory data (aspartate aminotransferase [AST], alanine aminotransferase [ALT], alkaline phosphatase [ALP], γ-glutamyl transpeptidase [GGT], total cholesterol, triglycerides, high-density lipoprotein [HDL], low-density lipoprotein [LDL], and fasting glucose) were collected. Body mass index (BMI) was calculated as body weight (kg) divided by the square of height (m2).

TE and CAP Measurements

CAP measurements were obtained using TE (FibroScan 502 touch, Echosens, Paris, France) by trained technicians blinded to patients’ clinical and histologic data. All measurements were performed on the right hepatic lobe through the intercostal spaces of the donor candidates lying in the dorsal position with the right arm in abduction. The CAP was calculated as the attenuation of the ultrasonic signal at 3.5 MHz acquired by TE. The principles of CAP measurement have been previously described in detail [19]. The CAP values were expressed in dB/m, and the median of successful measurements was selected as the representative value. The success rate was calculated as the ratio of the number of successful acquisitions to the total number of measurements. As an indicator of variability, the interquartile range (IQR)-to-median ratio was calculated. In this study, CAP measurements with 10 valid shots, a success rate of at least 60%, and an IQR-to-median ratio of less than 30% were considered reliable and used for statistical analysis [20,21].

Liver Biopsy

US-guided percutaneous biopsy was performed during the living liver donor work-up on the right hepatic lobe using an 18-gauge needle (Stericut 18G coaxial, TSK Laboratory, Tochigi, Japan). Two or more biopsy specimens, each approximately 1.5 cm in length, were obtained and stained with hematoxylin and eosin. The degree of MaS, which was the percentage of hepatocytes that contained intracellular macrovesicular fat droplets, was assessed quantitatively. MaS of >10% was considered to be substantial [7].

Statistical Analysis

Continuous variables were expressed as means with standard deviations or medians with IQRs, as appropriate. Pearson correlation coefficients (r) were calculated to evaluate correlations between variables. Differences between two continuous variables were analyzed using the Mann-Whitney U test. The normality of the CAP values in the reference population with histologic MaS of ≤10% was checked using the Shapiro-Wilk test. The lower and upper limits of the reference range were estimated to be the 2.5th and 97.5th percentiles, respectively, of the distribution of CAP values in the reference population. The performance of CAP for diagnosing substantial MaS (>10%) was estimated using the area under the receiver operating characteristic curve (AUROC) with the 95% confidence interval (CI). The cutoff value for CAP was chosen to maximize the sum of the sensitivity and specificity on the Youden index. At the optimal cutoff value, the sensitivity, specificity, positive predictive value (PPV), and negative predictive value (NPV) with their 95% CIs were determined. A P-value of <0.05 was considered to indicate statistical significance. Statistical analyses were performed using SPSS version 23.0 (IBM Corp., Armonk, NY, USA) and MedCalc version 16.2.1 (MedCalc Software, Ostend, Belgium).

Results

Characteristics of the Study Subjects

A total of 204 potential living liver donors (mean age, 30.5±9.1 years; 133 male and 71 female) were included in the analysis. The characteristics of the included subjects are summarized in Table 1. Of these donor candidates, 185 (90.7%) had MaS of ≤10% and 19 (9.3%) had MaS of >10%. The median CAP value in our study subjects was 214 dB/m (IQR, 190 to 241 dB/m).

Correlations with CAP

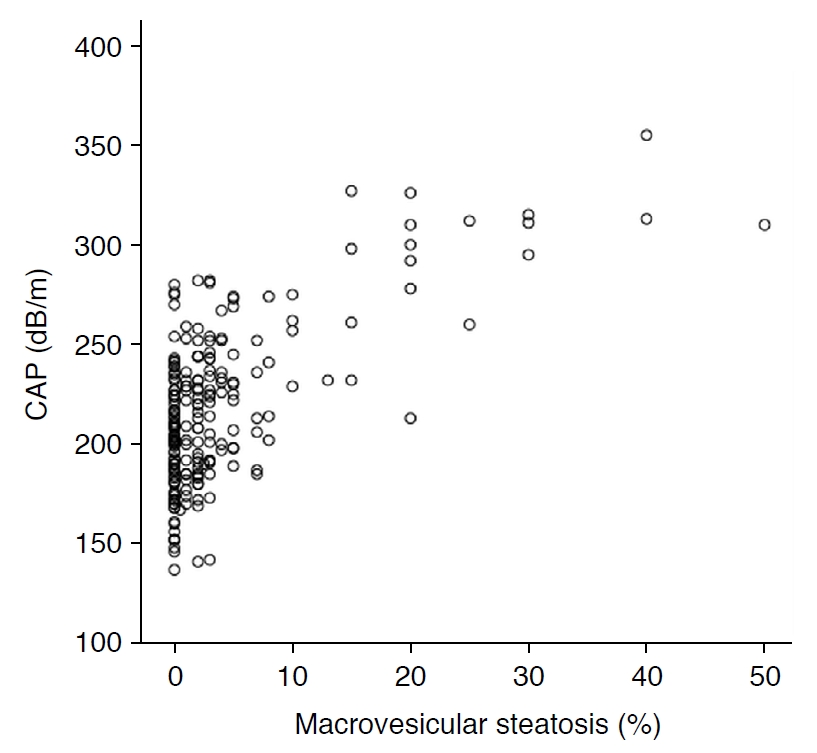
CAP was significantly correlated with BMI (r=0.561, P<0.001), AST (r=0.302, P<0.001), ALT (r=0.448, P<0.001), GGT (r=0.231, P=0.001), total cholesterol (r=0.283, P<0.001), triglycerides (r=0.364, P<0.001), HDL (r=-0.270, P<0.001), LDL (r=0.309, P<0.001), fasting glucose (r=0.195, P=0.005), and the percentage of MaS on liver biopsy (r=0.635, P<0.001) (Fig. 2) but not with ALP (Table 2).

Distribution of CAP Based on MaS

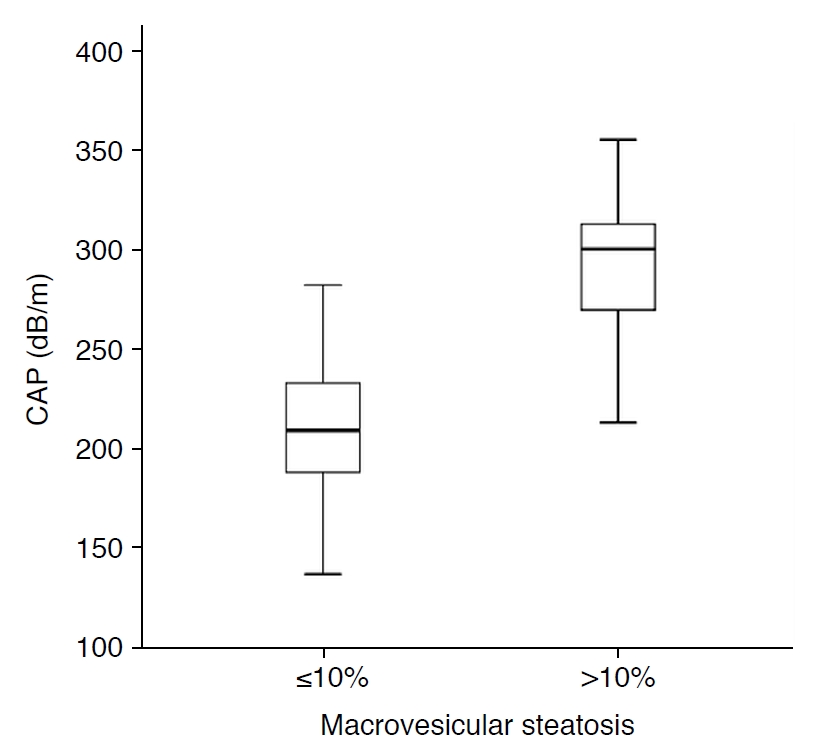
The median CAP values for subjects with MaS of ≤10% and MaS of >10% were 209 dB/m (IQR, 188 to 233 dB/m) and 300 dB/m (IQR, 261 to 313 dB/m), respectively. CAP values were significantly higher in subjects with MaS of >10% than in those with MaS of ≤10% (P<0.001) (Fig. 3).

Reference Range for CAP in patients with MaS of ≤10%

The CAP values in the reference population with histologic MaS of ≤10% ranged from 149 to 276 dB/m and followed a Gaussian distribution (P=0.170, Shapiro-Wilk test) (Supplementary Fig. 1).

Diagnostic Performance of CAP for MaS

For diagnosing substantial MaS (>10%), the AUROC of CAP was 0.938 (95% CI, 0.896 to 0.967), and the optimal cutoff value was determined to be 259 dB/m (Fig. 4). Using this cutoff value, the sensitivity, specificity, PPV, and NPV for diagnosing substantial MaS (>10%) were 84.2% (95% CI, 60.4% to 96.6%), 92.4% (95% CI, 87.6% to 95.8%), 53.3% (95% CI, 34.3% to 71.7%), and 98.3% (95% CI, 95.0% to 99.6%), respectively (Table 3).

Discussion

This study demonstrated that the CAP obtained using TE was closely correlated with the degree of MaS in histologic analyses of biopsy samples from potential living liver donors. Our results also showed that CAP had excellent diagnostic accuracy for detecting substantial MaS, with an AUROC of 0.938. Therefore, CAP is potentially useful for identifying substantial MaS (>10%), which may hinder the success of LT.
MaS in donated livers has been reported to be associated with poor graft function, including early graft dysfunction and primary nonfunction in recipients, which can result in decreased graft survival [22]. MaS also impairs the recovery and regeneration of remnant liver in living donors. The large fat vacuoles of MaS are believed to reduce sinusoidal blood flow and disturb the hepatic microcirculation, making liver grafts more vulnerable to ischemia-reperfusion injury [23]. In addition, cellular, biochemical, and signaling processes are interrupted in hepatic steatosis, leading to mitochondrial dysfunction and endoplasmic reticulum stress, which can affect the process of liver regeneration [24]. Although the acceptable degree of MaS for living liver donation remains controversial, MaS of less than 10% has been commonly used as a threshold for LDLT to ensure recipient outcome and donor safety [4-6].
Limited studies have evaluated hepatic steatosis in potential living liver donors using the CAP measured by TE [17,18]. Hong et al. [17] evaluated the usefulness of CAP for detecting steatosis in 55 living liver donor candidates. The authors found that the AUROC of CAP for identifying total steatosis (>33%) was 0.88 with a cutoff value of 276 dB/m using US-guided liver biopsy as the reference standard [17]. In another study by Yen et al. [18], 54 living liver donors were assessed using the CAP, and the results were compared with intraoperative biopsy. In that study, the CAP had an AUROC of 0.96 for detecting total steatosis (>5%) with a cutoff value of 257 dB/m [18]. Though these studies were limited by relatively small sample sizes, their findings suggest the utility of the CAP for detecting total steatosis.
Unlike these previous studies, we focused on MaS rather than total steatosis, since MaS is known to be independently associated with graft dysfunction [25,26]. This study demonstrated the excellent diagnostic accuracy of the CAP for detecting substantial MaS (>10%) in potential living liver donors, with an AUROC of 0.938. We found that the optimal cutoff value of the CAP for identifying substantial MaS was 259 dB/m, with a sensitivity of 84.2% and a specificity of 92.4%. The CAP measured by TE has many advantages, including its noninvasive, nonionizing, quantitative, rapid, and reproducible features, suggesting that this parameter may be a promising tool for screening potential living liver donors. In living liver donor candidates, a CAP cutoff value of 259 dB/m may potentially be used to detect those with substantial MaS.
Previous studies have shown that rates of unreliable CAP measurements ranged from 28% to 57% in the population with chronic liver disease or NAFLD [27-29]. Although the rate of unreliable CAP measurements in our study was lower than in previous studies of patients with chronic liver disease or NAFLD, the rate of unreliable CAP measurements in our study (8.4%) was somewhat disappointing because living liver donor candidates are usually young and healthy. The unreliable measurement rate may be a limitation of the CAP.
This study had several limitations. First, it was a single-center, retrospective study in which selection bias was unavoidable. Second, the number of subjects with MaS of >10% was small. Third, this study was conducted in an East Asian population with a mean BMI of 22.7 kg/m2, potentially limiting its applicability to a Western population. Due to these limitations, our results need to be validated in prospective, large-scale, multi-center studies.
In conclusion, the CAP measured by TE was significantly correlated with MaS and accurately detected substantial MaS in potential living liver donors. Thus, the CAP is a promising tool for the noninvasive diagnosis of MaS and may be used to screen unsuitable living liver donor candidates.

Notes

Author Contributions

Conceptualization: Lee S, Kim KW. Data acquisition: Lee S, Kim KW, Kim SY, Seo N, Song GW, Lee SG. Data analysis or interpretation: Kim KW. Drafting of the manuscript: Lee S, Kim KW. Critical revision of the manuscript: Kim KW, Kim SY, Seo N, Song GW, Lee SG. Approval of the final version of the manuscript: all authors.

Conflict of Interest

No potential conflict of interest relevant to this article was reported.

Supplementary Material

Supplementary Fig. 1.

Histogram shows distribution of controlled attenuation parameter (CAP) values in 185 subjects with histologic macrovesicular steatosis of ≤10%. Each bar represents number of subjects for each 20 dB/m-CAP range. Overlaid curve indicates a Gaussian distribution (https://doi.org/10.14366/usg.21071).
usg-21071-supple.pdf

References

1. European Association for the Study of the Liver. EASL Clinical Practice Guidelines: liver transplantation. J Hepatol 2016;64:433–485.
crossref pmid
2. Lee SG. A complete treatment of adult living donor liver transplantation: a review of surgical technique and current challenges to expand indication of patients. Am J Transplant 2015;15:17–38.
crossref pmid
3. Mikolasevic I, Filipec-Kanizaj T, Mijic M, Jakopcic I, Milic S, Hrstic I, et al. Nonalcoholic fatty liver disease and liver transplantation: where do we stand? World J Gastroenterol 2018;24:1491–1506.
crossref pmid pmc
4. Sharma A, Ashworth A, Behnke M, Cotterell A, Posner M, Fisher RA. Donor selection for adult-to-adult living donor liver transplantation: well begun is half done. Transplantation 2013;95:501–506.
pmid pmc
5. Trotter JF, Campsen J, Bak T, Wachs M, Forman L, Everson G, et al. Outcomes of donor evaluations for adult-to-adult right hepatic lobe living donor liver transplantation. Am J Transplant 2006;6:1882–1889.
crossref pmid
6. Valentin-Gamazo C, Malago M, Karliova M, Lutz JT, Frilling A, Nadalin S, et al. Experience after the evaluation of 700 potential donors for living donor liver transplantation in a single center. Liver Transpl 2004;10:1087–1096.
crossref pmid
7. Miller CM, Durand F, Heimbach JK, Kim-Schluger L, Lee SG, Lerut J, et al. The International Liver Transplant Society Guideline on Living Liver Donation. Transplantation 2016;100:1238–1243.
crossref pmid
8. Chang Y, Kim JI, Lee B, Kim SG, Jung MJ, Kim YS, et al. Clinical application of ultrasonography-guided percutaneous liver biopsy and its safety over 18 years. Clin Mol Hepatol 2020;26:318–327.
crossref pmid pmc
9. Ryan CK, Johnson LA, Germin BI, Marcos A. One hundred consecutive hepatic biopsies in the workup of living donors for right lobe liver transplantation. Liver Transpl 2002;8:1114–1122.
crossref pmid
10. Buscarini L, Fornari F, Bolondi L, Colombo P, Livraghi T, Magnolfi F, et al. Ultrasound-guided fine-needle biopsy of focal liver lesions: techniques, diagnostic accuracy and complications. A retrospective study on 2091 biopsies. J Hepatol 1990;11:344–348.
crossref pmid
11. Zhang X, Wong GL, Wong VW. Application of transient elastography in nonalcoholic fatty liver disease. Clin Mol Hepatol 2020;26:128–141.
crossref pmid pmc
12. Stern C, Castera L. Non-invasive diagnosis of hepatic steatosis. Hepatol Int 2017;11:70–78.
crossref pmid
13. Shi KQ, Tang JZ, Zhu XL, Ying L, Li DW, Gao J, et al. Controlled attenuation parameter for the detection of steatosis severity in chronic liver disease: a meta-analysis of diagnostic accuracy. J Gastroenterol Hepatol 2014;29:1149–1158.
crossref pmid
14. Wang Y, Fan Q, Wang T, Wen J, Wang H, Zhang T. Controlled attenuation parameter for assessment of hepatic steatosis grades: a diagnostic meta-analysis. Int J Clin Exp Med 2015;8:17654–17663.
pmid pmc
15. Karlas T, Petroff D, Sasso M, Fan JG, Mi YQ, de Ledinghen V, et al. Individual patient data meta-analysis of controlled attenuation parameter (CAP) technology for assessing steatosis. J Hepatol 2017;66:1022–1030.
crossref pmid
16. Pu K, Wang Y, Bai S, Wei H, Zhou Y, Fan J, et al. Diagnostic accuracy of controlled attenuation parameter (CAP) as a non-invasive test for steatosis in suspected non-alcoholic fatty liver disease: a systematic review and meta-analysis. BMC Gastroenterol 2019;19:51.
crossref pmid pmc
17. Hong YM, Yoon KT, Cho M, Chu CW, Rhu JH, Yang KH, et al. Clinical usefulness of controlled attenuation parameter to screen hepatic steatosis for potential donor of living donor liver transplant. Eur J Gastroenterol Hepatol 2017;29:805–810.
crossref pmid
18. Yen YH, Kuo FY, Lin CC, Chen CL, Chang KC, Tsai MC, et al. Predicting hepatic steatosis in living liver donors via controlled attenuation parameter. Transplant Proc 2018;50:3533–3538.
crossref pmid
19. Sasso M, Beaugrand M, de Ledinghen V, Douvin C, Marcellin P, Poupon R, et al. Controlled attenuation parameter (CAP): a novel VCTE guided ultrasonic attenuation measurement for the evaluation of hepatic steatosis: preliminary study and validation in a cohort of patients with chronic liver disease from various causes. Ultrasound Med Biol 2010;36:1825–1835.
crossref pmid
20. Caussy C, Alquiraish MH, Nguyen P, Hernandez C, Cepin S, Fortney LE, et al. Optimal threshold of controlled attenuation parameter with MRI-PDFF as the gold standard for the detection of hepatic steatosis. Hepatology 2018;67:1348–1359.
crossref pmid pmc
21. Semmler G, Woran K, Scheiner B, Unger LW, Paternostro R, Stift J, et al. Novel reliability criteria for controlled attenuation parameter assessments for non-invasive evaluation of hepatic steatosis. United European Gastroenterol J 2020;8:321–331.
crossref pmid pmc
22. Kulik U, Lehner F, Klempnauer J, Borlak J. Primary non-function is frequently associated with fatty liver allografts and high mortality after re-transplantation. Liver Int 2017;37:1219–1228.
crossref pmid
23. Selzner N, Selzner M, Jochum W, Amann-Vesti B, Graf R, Clavien PA. Mouse livers with macrosteatosis are more susceptible to normothermic ischemic injury than those with microsteatosis. J Hepatol 2006;44:694–701.
crossref pmid
24. Sahini N, Borlak J. Recent insights into the molecular pathophysiology of lipid droplet formation in hepatocytes. Prog Lipid Res 2014;54:86–112.
crossref pmid
25. Spitzer AL, Lao OB, Dick AA, Bakthavatsalam R, Halldorson JB, Yeh MM, et al. The biopsied donor liver: incorporating macrosteatosis into high-risk donor assessment. Liver Transpl 2010;16:874–884.
crossref pmid
26. Dutkowski P, Schlegel A, Slankamenac K, Oberkofler CE, Adam R, Burroughs AK, et al. The use of fatty liver grafts in modern allocation systems: risk assessment by the balance of risk (BAR) score. Ann Surg 2012;256:861–868.
pmid
27. Wong VW, Petta S, Hiriart JB, Camma C, Wong GL, Marra F, et al. Validity criteria for the diagnosis of fatty liver by M probe-based controlled attenuation parameter. J Hepatol 2017;67:577–584.
crossref pmid
28. Thiele M, Rausch V, Fluhr G, Kjaergaard M, Piecha F, Mueller J, et al. Controlled attenuation parameter and alcoholic hepatic steatosis: Diagnostic accuracy and role of alcohol detoxification. J Hepatol 2018;68:1025–1032.
crossref pmid
29. Eddowes PJ, Sasso M, Allison M, Tsochatzis E, Anstee QM, Sheridan D, et al. Accuracy of FibroScan controlled attenuation parameter and liver stiffness measurement in assessing steatosis and fibrosis in patients with nonalcoholic fatty liver disease. Gastroenterology 2019;156:1717–1730.
crossref pmid

Flowchart of the study subjects.

CAP, controlled attenuation parameter; TE, transient elastography; US, ultrasound.
usg-21071f1.jpg
Fig. 1.

Correlation between controlled attenuation parameter (CAP) and the percentage of macrovesicular steatosis in potential living liver donors (r=0.635, P<0.001).

usg-21071f2.jpg
Fig. 2.

Distribution of controlled attenuation parameter (CAP) based on histologic macrovesicular steatosis of ≤10% or >10%.

CAP values were significantly higher in subjects with macrovesicular steatosis of >10% than in those with macrovesicular steatosis of ≤10% (P<0.001).
usg-21071f3.jpg
Fig. 3.

Receiver operating characteristic curve of controlled attenuation parameter for the diagnosis of macrovesicular steatosis of >10%.

AUROC, area under the receiver operating characteristic curve; CI, confidence interval.
usg-21071f4.jpg
Fig. 4.
Table 1.
Characteristics of the study subjects
Characteristics Total (n=204) Macrovesicular steatosis ≤10% (n=185) Macrovesicular steatosis >10% (n=19) P-value
Demographic variable
Age (year) 30.5±9.1 30.2±8.9 33.7±10.7 0.111
Male sex 133 (65.2) 117 (63.2) 16 (84.2) 0.079
Anthropometric measurements
Body weight (kg) 65.0±11.0 64.2±10.7 73.3±10.4 <0.001
Body mass index (kg/m2) 22.7±2.9 22.5±2.8 25.0±2.9 <0.001
Laboratory data
AST (IU/L) 18.5±5.9 17.8±5.2 25.6±8.0 <0.001
ALT (IU/L) 17.9±12.4 16.0±10.1 36.7±16.8 <0.001
ALP (IU/L) 63.3±18.0 63.1±18.2 65.3±16.7 0.618
GGT (IU/L) 21.3±18.7 19.9±18.3 35.2±17.2 0.001
Total cholesterol (mg/dL) 173.1±28.7 171.2±28.1 192.1±28.6 0.002
Triglycerides (mg/dL) 95.7±50.2 90.9±46.0 142.0±65.4 0.003
HDL (mg/dL) 56.1±14.9 57.0±14.8 47.2±13.2 0.006
LDL (mg/dL) 97.9±27.4 96.0±27.0 116.5±25.5 0.003
Fasting glucose (mg/dL) 90.0±9.3 89.6±9.0 93.2±11.4 0.115
Liver histology
Total hepatic steatosis grade <0.001
S0 (<5%) 122 (59.8) 122 (65.9) 0
S1 (5%-33%) 75 (36.8) 63 (34.1) 12 (63.2)
S2 (34%-66%) 7 (3.4) 0 7 (36.8)
S3 (>66%) 0 0 0
Macrovesicular steatosis (%) 4.0±7.5 1.9±2.4 24.4±10.1 <0.001
Transient elastography
Controlled attenuation parameter (dB/m) 214 (190-241) 209 (188-233) 300 (261-313) <0.001
Liver stiffness measurement (kPa) 3.8 (3.3-4.6) 3.8 (3.3-4.6) 4.1 (3.7-5.1) 0.096

Values are presented as mean±standard deviation, number (%) or medina (IQR).

AST, aspartate aminotransferase; ALT, alanine aminotransferase; ALP, alkaline phosphatase; GGT, γ-glutamyl transpeptidase; HDL, high-density lipoprotein; LDL, low-density lipoprotein; IQR, interquartile range.

Table 2.
Correlations between the CAP and clinical parameters
CAP (dB/m)
Correlation coefficient (r) P-value
Body mass index (kg/m2) 0.561 <0.001a)
AST (IU/L) 0.302 <0.001a)
ALT (IU/L) 0.448 <0.001a)
ALP (IU/L) 0.000 0.996
GGT (IU/L) 0.231 0.001a)
Total cholesterol (mg/dL) 0.283 <0.001a)
Triglycerides (mg/dL) 0.364 <0.001a)
HDL (mg/dL) -0.270 <0.001a)
LDL (mg/dL) 0.309 <0.001a)
Fasting glucose (mg/dL) 0.195 0.005a)
Macrovesicular steatosis (%) 0.635 <0.001a)

CAP, controlled attenuation parameter; AST, aspartate aminotransferase; ALT, alanine aminotransferase; ALP, alkaline phosphatase; GGT, γ-glutamyl transpeptidase; HDL, high-density lipoprotein; LDL, low-density lipoprotein.

a) Statistically significant results from the Pearson correlation coefficient analysis.

Table 3.
Diagnostic performance of the CAP for identifying macrovesicular steatosis of >10%
Macrovesicular steatosis >10%
AUROC (95% CI) 0.938 (0.896-0.967)
Optimal CAP cutoff value (dB/m)a) 259
Sensitivity (95% CI, %) 84.2 (60.4-96.6)
Specificity (95% CI, %) 92.4 (87.6-95.8)
PPV (95% CI, %) 53.3 (34.3-71.7)
NPV (95% CI, %) 98.3 (95.0-99.6)

CAP, controlled attenuation parameter; AUROC, area under the receiver operating characteristics curve; CI, confidence interval; PPV, positive predictive value; NPV, negative predictive value.

a) Optimal CAP cutoff value defined by the maximal sum of sensitivity and specificity.

TOOLS
METRICS
2
Crossref
0
Scopus
4,786
View
82
Download
We recommend
Editorial Office
A-304 Mapo Trapalace, 53 Mapo-daero, Mapo-gu, Seoul 04158, Korea
TEL : +82-2-763-5627   FAX : +82-2-763-6909   E-mail : office@ultrasound.or.kr
About |  Browse Articles |  Current Issue |  For Authors and Reviewers
Copyright © Korean Society of Ultrasound in Medicine.                 Developed in M2PI
Zoom in Close layer