

 Print
Print facebook
 twitter
 Linkedin
 google+

Introduction
Autoimmune hepatitis (AIH) is an immune-mediated hepatic inflammation of unknown cause [1]. The diagnosis of AIH requires typical histological features (interface hepatitis), characteristic clinical and laboratory findings (elevated serum aspartate aminotransferase [AST] and alanine transaminase [ALT] levels and increased serum IgG concentration), and the presence of one or more characteristic autoantibodies (anti-nuclear antibody, smooth muscle antibody, or anti-liver/kidney microsomal antibodies type 1) [2,3].
If left untreated, AIH can progress to advanced fibrosis and cirrhosis with various liver-related complications [1]. Fortunately, it has been determined that immunosuppressive treatment is effective for AIH. However, recent studies have reported that liver fibrosis and even cirrhosis can regress during proper treatment in patients with AIH, as proven by repeated biopsies [4,5]. Therefore, the assessment of the severity of liver fibrosis can directly impact the management and monitoring of disease progression in the treatment of patients with AIH [6,7].
Currently, liver biopsy is considered the reference standard for quantifying liver fibrosis [8]. However, liver biopsy is an invasive technique with the risk of several complications, such as pain and hemorrhage, and its use can be limited in regular follow-up [9]. As a result, there is a need for the development of a non-invasive and repeatable test to assess liver fibrosis in AIH. Ultrasound (US) elastography, including transitional elastography (TE), has been widely used as an accurate non-invasive method to assess liver fibrosis. However, data on the effectiveness of the new modality of two-dimensional (2D) shear wave elastography (SWE), which can measure both liver stiffness (LS) and the dispersion slope (DS), are limited in patients with AIH. In addition, very few studies have used 2D SWE to evaluate the treatment response in patients with AIH [10].
Therefore, the purpose of this study was to determine the usefulness of 2D SWE with assessment of LS values and DS to evaluate hepatic fibrosis and the treatment response in patients with AIH.
Materials and Methods
Compliance with Ethical Standards
This retrospective, single-center study was approved by the institutional review board (Wonkwang University Hospital, 2021-07-031-001) of the authorsŌĆÖ affiliated hospital, which waived the need for written informed consent.
Patients
Between June 2014 and June 2021, 69 patients diagnosed with AIH were enrolled. The inclusion criteria were as follows: patients diagnosed with AIH according to the International Autoimmune Hepatitis Group score [2], patients who underwent 2D SWE and liver biopsy within 1 week, and patients older than 18 years of age.
The exclusion criteria were as follows: patients who were diagnosed with AIH in combination with other liver-related diseases; patients who did not undergo 2D SWE and/or liver biopsy; patients who had inadequate histologic results; patients who were younger than 18 years; and patients who underwent 2D SWE and liver biopsy with an interval of more than 1 week (Fig. 1).
Patients diagnosed with AIH were managed with or without steroid therapy according to the physicianŌĆÖs decision under international practice guidelines [1].
Baseline characteristics, laboratory test results, histologic results, and 2D SWE results were collected from electronic medical records and picture archiving and communication systems.
2D SWE Measurements
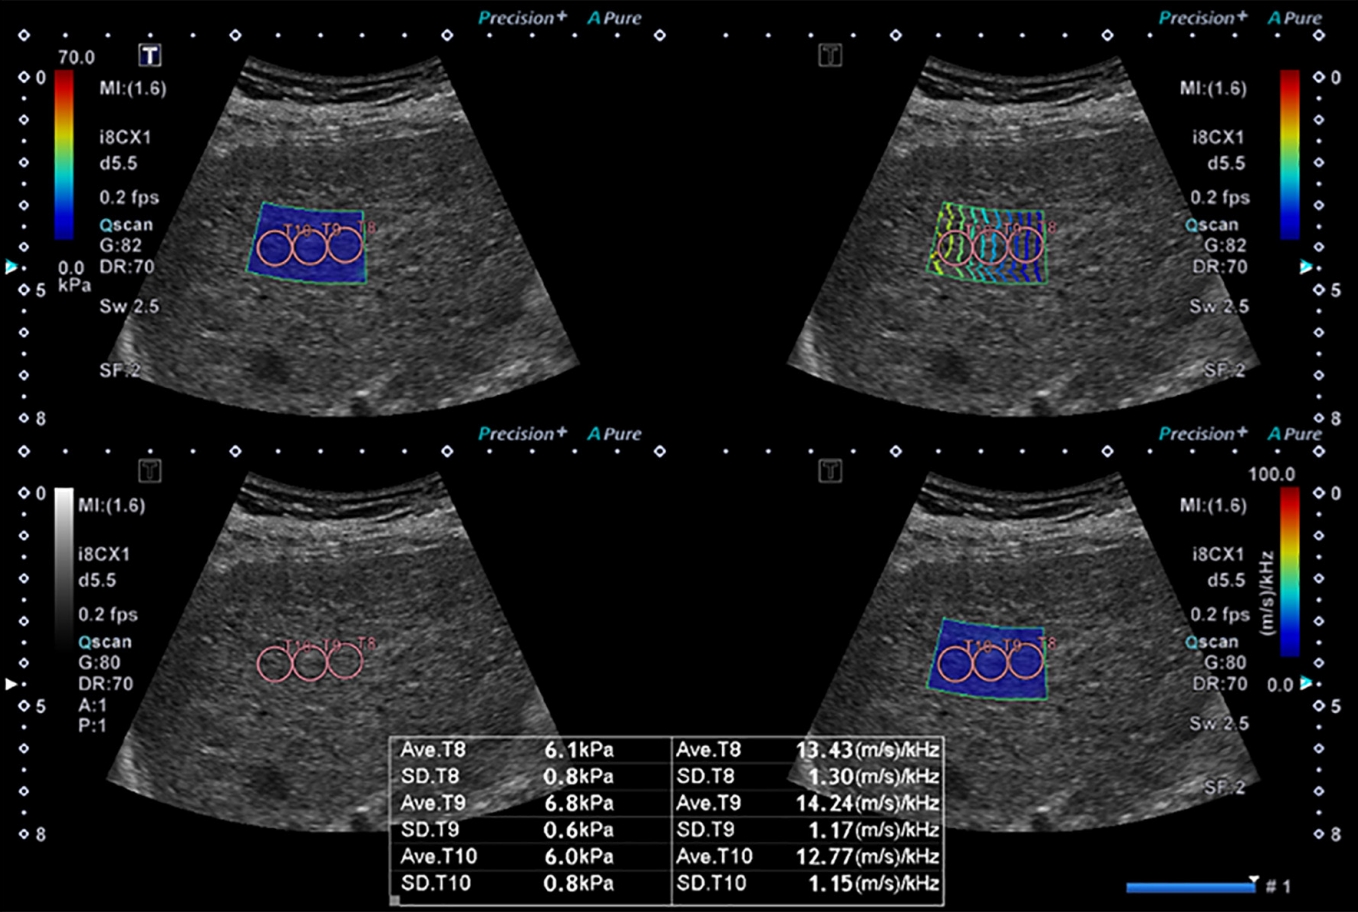
The 2D SWE measurements were performed using two US machines: the Aixplorer US system (SuperSonic Imagine, Aix-en-Provence, France) with a convex broadband probe (SC6-1, 1-6 MHz) (from June 2014 to January 23, 2018) and the Aplio i800 system (Canon Medical Systems Corporation, Tokyo, Japan) with a convex broadband probe (PVI-475BX, 1-8 MHz) (from January 24, 2018 to June 2021). All measurements were performed by one of the two radiologists. All patients were asked to fast for at least 6 hours prior to the examination. The patients raised their right arm above their head in the supine position to obtain the proper intercostal space and were asked to hold their breath during the measurement. The liver parenchymal echotexture was initially evaluated using B-mode imaging. Thereafter, 2D SWE was performed, placing a 2.5├Ś2.5 cm sample box within the liver parenchyma on grayscale imaging. The sample box was placed at the parenchyma of the right hepatic lobe, 2 cm under the liver capsule, to avoid reverberation artifacts. The 2D SWE images were obtained according to the European Federation of Societies for Ultrasound in Medicine and Biology [11] and the World Federation of Societies for Ultrasound in Medicine and Biology [12] practice guidelines. The shear wave propagation data were acquired after the sample box was placed. Using the Aplio i800, the US system automatically displays the twin view of the grayscale images and shear wave propagation maps. The display was then switched to the quad-view mode, showing four maps simultaneously (the elasticity map, propagation map to visualize the confidence of the measurements, grayscale image as a reference, and the DS map) after a 5-s cooling time. Three 1-cm circular regions of interest (ROIs) were placed on each map in the sample box to avoid large hepatic vessels. Under guidance of the propagation map, ROIs were placed in the area exhibiting smooth and parallel lines on the propagation map, indicating stable measurements without reverberation or motion artifacts [13]. Using an elasticity map, LS was measured in units of kilopascals (kPa). Using a dispersion map, the DS was measured, with units of (m/s)/kHz. Activation of shear wave propagation and data filling of the sample box were performed three or four times for each patient, and one shear wave propagation data point had three ROIs. Therefore, 9-12 measurements of the LS and DS were made for each patient (Fig. 2). Measurements were considered reliable only when they were less than 30% of the interquartile range/median value. The median values of valid LS and DS measurements were chosen for further analysis.
Most patients visited every 6 months after their initial diagnosis of AIH, regardless of the type of medication. Follow-up SWE was generally performed 1 year after the initial examination and the second visit after the diagnosis; however, the interval was variable according to the physicianŌĆÖs discretion (15.9┬▒11.3 months). Follow-up examinations were performed in the same manner as the initial examinations.
Liver Biopsy
After 2D SWE measurements, a percutaneous liver biopsy was performed on the same day. Biopsy was performed twice with an 18-gauge semi-automatic biopsy gun (STARCUT, TSK Laboratory, Tochigi, Japan) in the right hepatic lobe. All specimens obtained from each patient were fixed in formalin, embedded in paraffin, stained with hematoxylin-eosin, and counterstained with one of two stains (reticulin or Masson). The samples were evaluated by a pathologist with more than 10 years of experience. The fibrosis stage was defined according to the METAVIR classification as normal (F0), mild fibrosis (F1), significant fibrosis (F2), advanced fibrosis (F3), and cirrhosis (F4) [14].
Laboratory Tests
The clinical data and laboratory findings of AIH patients, including AST, ALT, alkaline phosphatase (ALP), gamma glutamyl transferase (GGT), albumin, total bilirubin, platelet count, and IgG, were collected on the same day as the 2D SWE measurements. Laboratory data were collected and analyzed to evaluate liver fibrosis, including the aspartate aminotransferase to platelet ratio index (APRI) [15] and fibrosis-4 index (FIB-4) [16].
Statistical Analysis
The LS, DS, and laboratory test results are expressed as mean┬▒standard deviation with range and normal distribution. The paired t test with the Bonferroni correction was used to compare variables before and after treatment. One-way analysis of variance was used to compare the LS and DS values among the histological liver fibrosis stages. The correlation between LS values and liver fibrosis was computed using the Spearman correlation coefficient. Correlation coefficient values were characterized as follows: negligible, ŽüŌēż0.3; low, 0.3<ŽüŌēż0.5; moderate, 0.5<ŽüŌēż0.7; high, 0.7<ŽüŌēż0.9; and very high, ŽüŌēź0.9 [17]. The diagnostic performance of LS for liver fibrosis staging was evaluated using the receiver operating characteristic (ROC) curve and the area under the ROC curve (AUC). The optimal cutoff value showing the best diagnostic performance was calculated using the Youden index, maximizing sensitivity plus specificity. Statistical significance was set at P<0.05. All statistical analyses were performed using commercial statistical software (IBM SPSS Statistics for Windows version 26.0, IBM Corp., Armonk, NY, USA and MedCalc Software version 12.7.0, Ostend, Belgium).
Results
Demographics and Baseline Features
A total of 69 patients (60 women and 9 men) were analyzed, with a mean age of 59.7┬▒12.9 years. At the time of diagnosis, the mean modified AIH score was 13.5, with no statistically significant difference between men and women. The baseline characteristics of the 69 patients are listed in Table 1. The 69 patients were divided into four groups according to the METAVIR score (F1, n=17; F2, n=21; F3, n=16; and F4, n=15).
US and Serum Markers According to Fibrosis Stage
The mean values of LS were 7.3┬▒2.1 kPa in the F1 group, 12.9┬▒5.5 kPa in the F2 group, 13.0┬▒5.1 kPa in the F3 group, and 15.1┬▒4.2 kPa in the F4 group. The LS values were significantly different according to the stage of liver fibrosis (P<0.001). The mean values of DS were 11.8┬▒1.9 (m/s)/kHz in the F1 group, 17.4┬▒5.0 (m/s)/kHz in the F2 group, 14.9┬▒3.3 (m/s)/kHz in the F3 group, and 14.0┬▒3.7 (m/s)/kHz in the F4 group (P=0.044). The mean values of the laboratory tests, including AST, ALT, ALP, GGT, total bilirubin, albumin, and platelet count according to fibrosis grade at baseline are summarized in Table 2. There were no significant statistical differences in most laboratory findings among patients with different fibrosis stages, except albumin (P=0.047) and platelet count (P<0.001) (Table 2).
Diagnostic Performance of LS, APRI, and FIB-4 in the Grading of Liver Fibrosis and Their Comparisons
The AUCs and optimal cutoff values with the highest combined sensitivities and specificities of the LS value for detecting each stage of liver fibrosis are as follows: the AUC of the LS value was 0.903 (95% confidence interval [CI], 0.807 to 0.961; P<0.001; sensitivity, 90.4%; specificity, 82.4%) for ŌēźF2, 0.815 (95% CI, 0.703 to 0.898; P=0.001; sensitivity, 71.0%; specificity, 79.0%) for ŌēźF3, and 0.854 (95% CI, 0.748 to 0.927; P=0.002; sensitivity, 73.3%; specificity, 87.0%) for F4, respectively. The AUCs of APRI and FIB-4 for detecting each stage of liver fibrosis are summarized in Table 3.
The AUC of LS was significantly higher than that of APRI: ŌēźF2: LS vs. APRI, 0.903 vs. 0.657 (P<0.001); LS vs. FIB-4, 0.903 vs. 0.762 (P=0.020); ŌēźF3: LS vs. APRI, 0.815 vs. 0.531 (P<0.001); LS vs. FIB-4, 0.815 vs. 0.629 (P=0.008); F4: LS vs. APRI, 0.854 vs. 0.507 (P<0.001); and LS vs. FIB-4, 0.854 vs. 0.741 (P=0.193) (Fig. 3). The AUC values of the APRI and FIB-4 for detecting ŌēźF2 were 0.657 and 0.762 (P=0.106), respectively. The AUC values of APRI and FIB-4 for detecting ŌēźF3 were 0.531 and 0.629 (P=0.150), respectively, and the APRI and FIB-4 for detecting F4 were 0.507 and 0.741 (P=0.065), respectively.
Comparison of 2D SWE and Serum Markers before and after Steroid Therapy
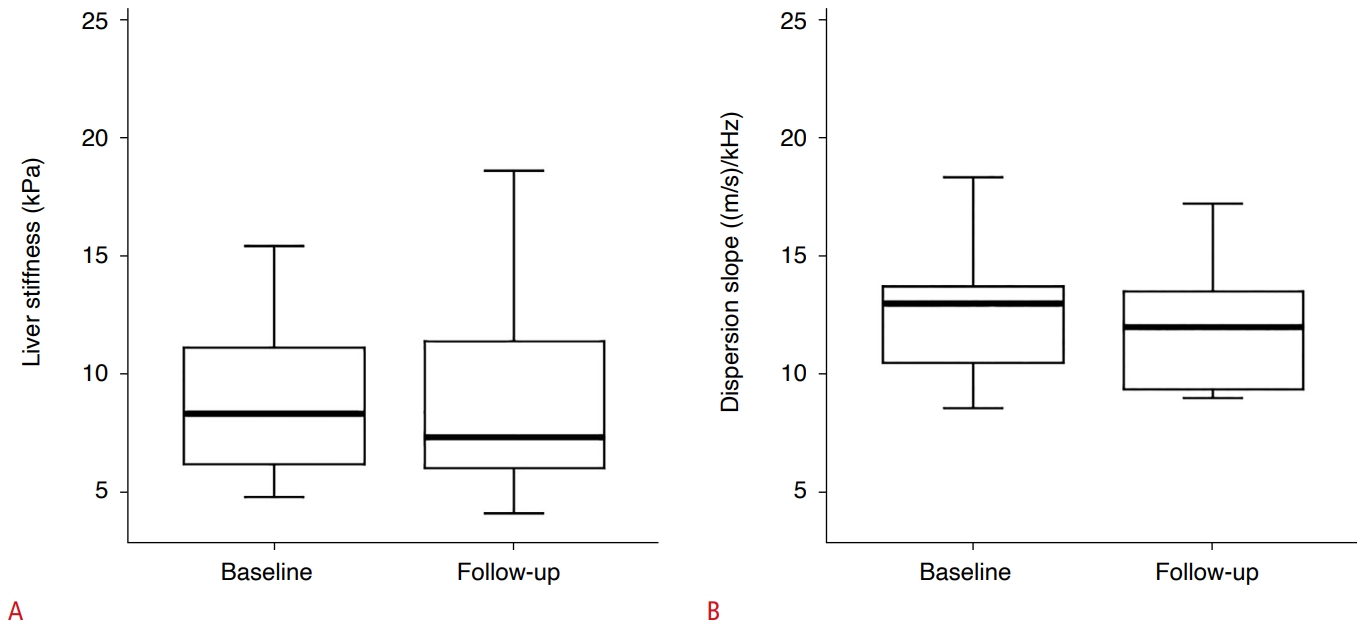
Twenty-five of the 69 patients did not receive steroid therapy, according to the physicianŌĆÖs decision. Seventeen of these 25 patients underwent follow-up SWE examinations (mean interval, 13.2 months). There was no significant difference in LS or DS between the baseline and follow-up examinations (P=0.824 and P=0.452, respectively) (Table 4, Fig. 4).
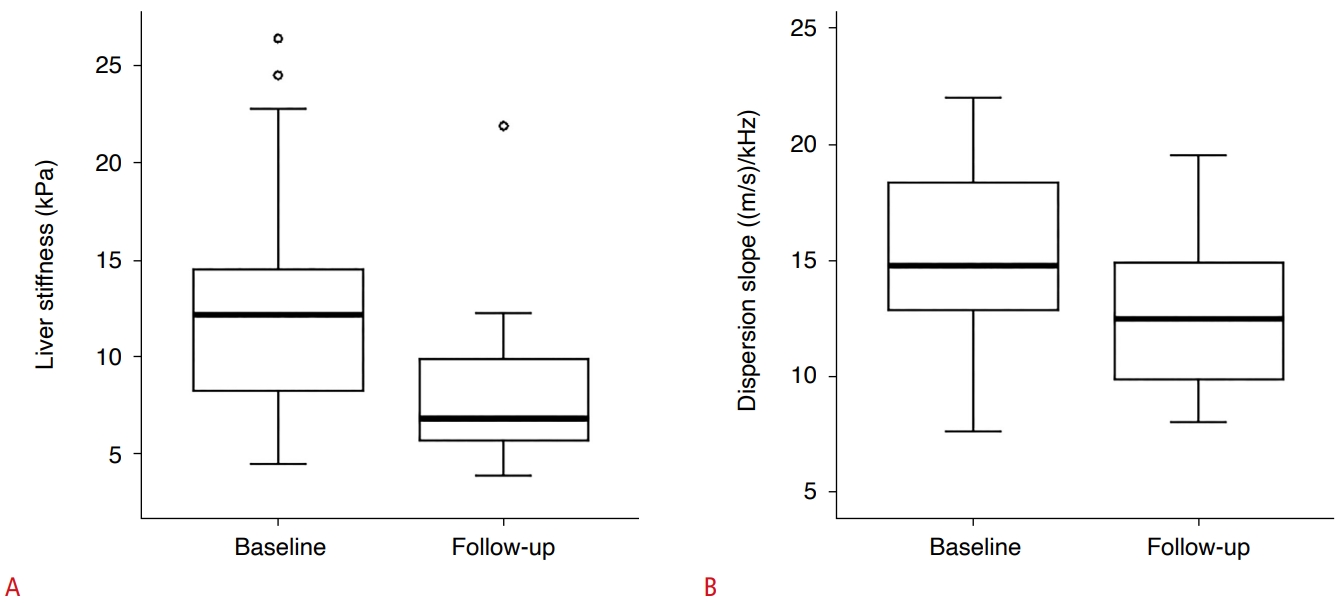
Forty-four of the 69 patients received steroid therapy, and 34 of these 44 patients underwent follow-up SWE examination (mean interval, 17.4 months). There were significant differences in both the LS and DS (P=0.012 and P=0.011, respectively) (Table 4, Fig. 5). Therefore, the LS and DS of the patients receiving steroid therapy exhibited statistically significant improvements.
Discussion
In this study, LS measurements using 2D SWE exhibited a high AUC for the diagnosis of hepatic fibrosis in AIH patients (0.815-0.903), and there was a statistically significant difference in LS according to fibrosis grade (P<0.001). This is comparable to previous studies that used TE in patients with AIH (ŌēźF2; AUC, 0.878) [18]. Previous reports have demonstrated better diagnostic performance of LS than biological parameters such as APRI and FIB-4 for the evaluation of liver fibrosis in patients with AIH [18-20]. Consistent with previous studies, these results indicate that LS measurements using 2D SWE are an accurate non-invasive method for the evaluation of liver fibrosis in patients with AIH, exhibiting better diagnostic performance than serum biomarkers.
On follow-up 2D SWE after steroid treatment in patients with AIH, LS values and DS decreased to a statistically significant degree (LS value, P=0.012; DS, P=0.011). Improved LS values during follow-up examinations can be interpreted as indicating resolved necroinflammation and regression of liver fibrosis. Previous studies have shown that after the initial treatment of patients with AIH, their LS value significantly decreased in only one month, suggesting improved hepatic inflammation [21,22]. In contrast, in long-term follow-up (more than 2-3 years) studies, some authors reported that liver fibrosis could regress during proper treatment in patients with AIH, as proven by a decrease in one or two stages on the Ishak scale [4,5]. However, a change in one or two stages of the Ishak scale corresponds to no significant change in the METAVIR classification, which was used as a histological reference. Therefore, the major factor that influenced the improvement of LS values in the relatively short-term follow-up examinations after treatment might have been the resolution of necroinflammation, rather than regressed hepatic fibrosis.
Shear wave dispersion (SWD) is an emerging technology used to evaluate liver viscosity by measuring the dispersion slope of shear waves that can predict the degree of necroinflammation in the liver [23]. There is still uncertainty as to whether SWD is significantly correlated with lobular inflammation, as reflected by elevated liver enzymes [22,24]. Different conclusions regarding the correlation between SWD and hepatic inflammation have been reported depending on the etiology of chronic liver disease. Previous studies on liver transplantation and patients with nonalcoholic steatohepatitis demonstrated a positive correlation between DS and lobular inflammation [24,25]. In contrast, it has been reported that there was no significant correlation between DS change and improved liver enzyme levels after direct-acting antiviral agent therapy in patients with hepatitis C virus [26]. The data of this study showed a statistically significant improvement in DS on follow-up examinations, accompanied by improved AST and ALT levels. Based on these results, it is suggested that AIH may be one of the etiologies that can show a correlation between hepatic inflammation and DS.
To the best of the authorsŌĆÖ knowledge, this is the first study to compare LS and DS using 2D SWE before and after steroid therapy in patients with AIH. Decreases in LS and DS values were observed in patients receiving steroid treatment. The LS values at baseline may not reflect true liver fibrosis in patients with AIH and may be overestimated due to hepatic inflammation. Therefore, the authors suggest that radiologists should consider this potential confounding factor when interpreting the initial LS values of patients with AIH.
This study had several limitations. First, it was a single-center retrospective study, resulting in variable follow-up of 2D SWE examination among patients. Further prospective, multicenter studies are required to validate these results. Second, the area of the 2D SWE measurements might not have been the same as the biopsy region. Although an attempt was made to match the areas, mismatch errors were inevitable. Third, two US machines were used, depending on the date. However, this indicates that the results can be widely applied to various US vendors from different institutions.
In conclusion, 2D SWE is a useful method for the assessment of hepatic fibrosis in patients with AIH with high diagnostic performance. For follow-up examinations, the LS value and DS can be used as reliable parameters to evaluate treatment response with improvement of hepatic inflammation.


 Download Citation
 PDF Links
 PubReader
 ePub Link
 Full text via DOI
 Full text via PMC


