

 Print
Print facebook
 twitter
 Linkedin
 google+

Introduction
The incidence of prostate disease is high in adult men and increases with age [1]. The most frequent benign prostate disease is benign prostatic hyperplasia (BPH), and nearly one-third of all men experience symptomatic prostate enlargement [1,2]. BPH is common, affecting approximately 50% to 75% of men over the age of 50 years [3]. Prostate cancer is the second most common cancer and the fifth leading cause of cancer-related death among men in 2020 [4]. In patients with suspected symptoms of prostate disease, the primary examination is transrectal ultrasonography (US), with routine measurement of prostate volume [5]. Prostate volume is also important in patients with suspected prostate cancer and with an increase in prostate-specific antigen (PSA) levels, because the use of PSA density (PSAD), which is calculated as the PSA level divided by the prostate gland volume, can assist in the stratification of prostate cancer risk [6-8]. Conflicting results have been reported regarding the accuracy of US-based volume estimation: estimates using US have been reported in one study to underestimate and in another study to overestimate prostate gland volume [9,10].
Many studies have proven the usefulness of prebiopsy magnetic resonance imaging (MRI) to detect more clinically significant prostate cancer and less clinically insignificant cancer [11-14]. Therefore, prostate volume on MRI is also useful to stratify cancer risk by calculating the PSAD. The Prostate Imaging–Reporting and Data System (PIRADS) offers guidelines for obtaining, reviewing, and reporting prostate MRI. PIRADS recommends reporting prostate gland volume determined using manual or automated segmentation or calculated using an ellipsoid formulation based on three-axis diameters. PIRADS version 2.0 recommends measuring the anteroposterior (AP) diameter on axial images, although measurement using midsagittal images is recommended in PIRADS version 2.1 [15,16]. There is a theoretical risk of overestimating the AP diameter on axial images that are not perpendicular to the long axis of the prostate gland [17]. A previous study compared the accuracy of both methods on prostate MRI. This study showed that the PIRADS version 2.0 method was more accurate for measuring prostate gland volume compared with the segmented volume [18].
Regarding prostate volume measurement, it has not yet been established whether axial or sagittal images are better on prostate MRI. Considering the frequent use of transrectal US to evaluate the prostate gland, the same issue also seems important for US. Additionally, it is uncertain whether prostate volume estimates obtained using US can be directly compared with those derived from MRI. A previous study compared the differences in prostate volume estimates from US and MRI and those using the AP diameter on axial images and midsagittal images [9]. However, as the study included a small number of patients (n=21), further studies with more patients are needed. Moreover, inter-reader variability should be considered when using volume estimates measured by different observers as a reliable parameter for follow-up of the size of the prostate gland. The purpose of this study was to evaluate the accuracy of prostate volume estimates calculated from the ellipsoid formula using AP diameter measured on axial and sagittal images on US and MRI.
Materials and Methods
Compliance with Ethical Standards
This retrospective, multicenter study was approved by the institutional review boards of Seoul St. Mary's Hospital (KC21RISI0451) and Eunpyeong St. Mary's Hospital (PC21RASI0092). Informed consent for the patients was waived due to the retrospective study design.
Subjects
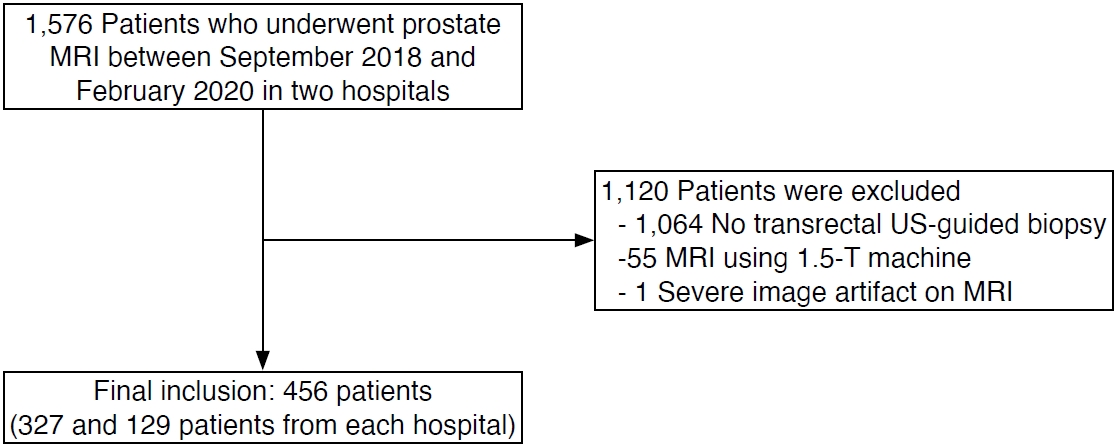
Patients who underwent prostate MRI examinations for clinically suspected prostate cancer between September 2018 and February 2020 in two university hospitals were eligible (n=1,576). In these hospitals, all transrectal US-guided prostate biopsies were performed by board-certified radiologists, while transrectal prostate US examinations in general were performed by physicians with varying levels of experience. Therefore, only patients who underwent transrectal US-guided biopsy were selected in order to guarantee a high image quality of the US examination. Among the eligible patients, the following were excluded: those who did not undergo transrectal US-guided biopsy within 1 month before and after MRI (n=1,064), as well as patients with MRI obtained at 1.5 T (n=55) or with severe artifacts on MRI (n=1). A total of 456 patients were included in this study (327 and 129 patients from each hospital) (Fig. 1). Clinical information on age, PSA level, biopsy results, and prostatectomy results (if available) was collected.
MRI Acquisition
Either biparametric MRI or multiparametric MRI was included in this study (88 biparametric MRI and 368 multiparametric MRI). Prostate MRI was performed using 3-T MRI (MAGNETOM Verio or MAGNETOM Vida, Siemens Healthcare, Erlangen, Germany) with a surface coil and a spine coil. Although three-plane T2-weighted images (T2WI), T1-weighted images, and diffusion-weighted images were included in all MRI examinations and dynamic contrastenhanced MRI in multiparametric MRI, only true axial and sagittal T2WI were used in the present study. Detailed parameters of T2WI are summarized in Table 1.
US Examination
Transrectal US biopsy was performed by one of four board-certified radiologists with 5, 6, 10, or 22 years of experience in prostate US, using a Philips iU22, Philips EPIQ 7 (Philips Medical Systems, Bothell, WA, USA) or a GE LOGIQ E10 (GE Healthcare, Milwaukee, WI, USA) device. The radiologists routinely obtained multiple axial and sagittal images of the prostate gland before biopsy.
Prostate Gland Volume Estimation Based on the Ellipsoid Formula
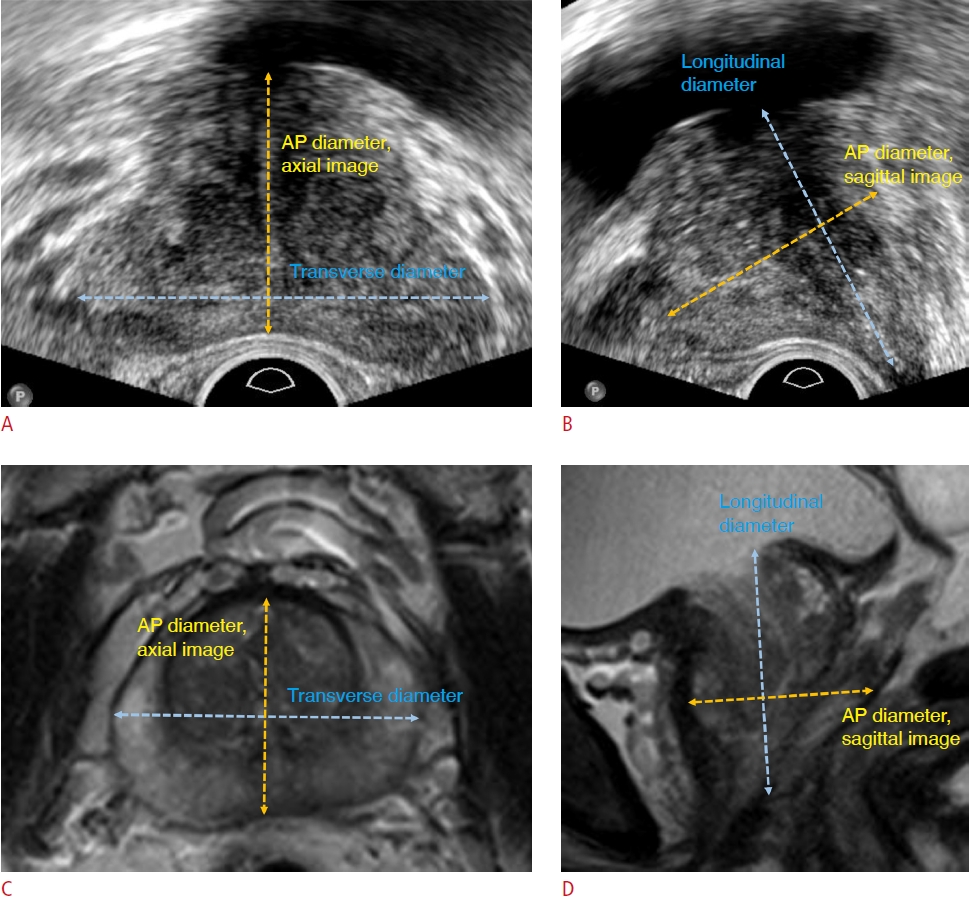
Two radiologists with 6 or 11 years of experience in prostate imaging independently measured the prostate gland diameters on the images obtained using both imaging modalities: AP diameter and transverse diameter on axial images and AP diameter and longitudinal diameter on midsagittal images (Fig. 2). Each radiologist retrospectively reviewed T2WI MRI and US images and measured the diameters on the picture archiving and communication system. In axial images, the radiologists found the plane depicting the maximal transverse diameter and measured the transverse and AP diameters on that plane [19]. The AP diameter was measured between the anterior and posterior margin of the prostate capsule, excluding the periprostatic vein. The longitudinal diameter was measured on the midsagittal plane that best showed the prostatic urethra. The longitudinal diameter is usually measured from the bladder neck to the prostate apex [20]. However, measurements of the longitudinal diameter can vary because of multiple landmarks. In this study, the superior margin was the bladder base, defined as a line connecting the anterior and posterior points where the bladder wall connected with prostate gland [21]. If the prostate tissue protruded above the line on the midsagittal plane, the proximal margin of the prostate tissue was used as the superior margin. The inferior landmark was the caudal margin of the peripheral zone defining the apex. As it is difficult to determine due to urethral continuation, an interpolated line connecting the margin of the peripheral zone located anterior and posterior to the urethra was used [21]. If there was prostate cancer with bulging contours or extensive prostate cancer replacing the prostate gland itself, the entire tumor was included in the prostate volume and diameter measurements.
Using the ellipsoid formula (prostate gland volume=AP diameter×transverse diameter×longitudinal diameter×0.52), volumeax (using the AP diameter from axial images) and volumesag (using the AP diameter from sagittal images) figures were calculated from US and MRI, respectively, to obtain US volumeax, US volumesag, MRI volumeax and MRI volumesag. The transverse diameter and longitudinal diameter were commonly used on each examination to calculate the volume.
Prostate Gland Segmentation on MRI and Gold Standard Prostate Gland Volume
Segmentation of the prostate gland was carried out in three steps. First, prostate gland segmentation was performed using noncommercially available, deep learning-based prototype software (Prostate AI version 1.2.4, Siemens Healthcare). The algorithm was trained and validated with 2,170 biparametric MRI scans [22] and included the function of prostate segmentation, lesion detection, and PIRADS classification of the lesions [23]. Only the automatic gland segmentation function was used in this study. Whole-gland segmentation is performed on the T2WI volume using a deep learning-based convolutional neural network, and the prostate gland volume was measured based on the segmentation [24]. The details of artificial intelligence algorithm are summarized in the Supplementary Material. Second, each case was randomly assigned to one of the two radiologists who had measured the prostate gland diameters, who then reviewed the MRI segmentation results. If needed, the radiologists manually revised the segmentation using a correction tool in the prototype software. If there was prostate cancer with bulging contours or extensive prostate cancer replacing the prostate gland, the entire tumor was included in the segmentation. Finally, a third radiologist, who did not participate in either measuring the prostate gland diameters or revising the prostate segmentation, confirmed that the final segmentation after the manual revision was correct. The prostate gland volume extracted from the segmentation was called the segmented volume and was considered to be the gold standard.
Statistical Analysis
Before the specific analysis, the normality of the data distribution was evaluated by the Kolmogorov–Smirnov test. All variables, including the diameters and prostate volume estimates, were non-normally distributed (P<0.001). Next, the differences in the two radiologists’ measurements were analyzed. The differences in the four types of diameters and two types of volume estimates, as measured by the two radiologists, were compared using Wilcoxon signed-rank test on US and MRI. Inter-reader agreement between the two radiologists for each measurement was assessed by using a two-way random intraclass correlation coefficient (ICC). The ICC was interpreted as follows: <0.5, poor; 0.5-0.75, moderate; 0.75-0.9, good; and >0.9, excellent agreement. Inter-reader agreement was assessed using Bland-Altman plots.
Next, inter-method agreement between the volumeax and volumesag was analyzed using ICC and Bland-Altman plots on US and MRI, respectively. The AP diameters on axial and sagittal images, as well as volumeax and volumesag were compared using the Wilcoxon signed-rank test for US and MRI. Lastly, the four types of volume estimates by ellipsoid methods were compared with segmented volume (i.e., the gold standard) using the Wilcoxon signed-rank test and Bland-Altman plots. Agreement between the gold standard and the volume estimates was assessed by using ICCs. The volume difference was calculated for the four types of volume estimates as follows: segmented volume minus estimated volume. The correlations between the volume difference and segmented volume were evaluated using the Pearson correlation test (r) and displayed on scatter plots.
Statistical analysis was performed using SPSS software version 24.0 (IBM Corp., Armonk, NY, USA) and GraphPad Prism version 8.0 (GraphPad Software, Inc., La Jolla, CA, USA). A P-value <0.05 was considered statistically significant.
Results
The baseline characteristics of the 456 patients are summarized in Table 2. The mean age of the patients was 68.9 years (standard deviation, ±8.4 years). The median interval between MRI and US was 19 days.
The diameters and volumes measured by the two radiologists and ICCs between the two radiologists are presented in Table 3. While the AP diameters measured on axial MRI, as well as those on sagittal MRI, were not significantly different between the two radiologists, the other types of diameters showed significant differences. All measurements showed excellent inter-reader agreement (ICC >0.9). Supplementary Fig. 1 shows that, as the average prostate gland volume increased, the difference between the two radiologists’ measurements tended to increase. The 95% limits of agreement between the two radiologists for the four volume estimates appeared similar.
The inter-method agreement between measurements on axial and sagittal images is shown in Table 4. Both reviewers’ results commonly showed excellent inter-method agreement in all measurements, except for AP diameters on US, which showed good agreement. As shown in Supplementary Fig. 2, the 95% limits of agreement between volumeax and volumesag were slightly wider on US than on MRI, and there was no systematic bias between the two methods.
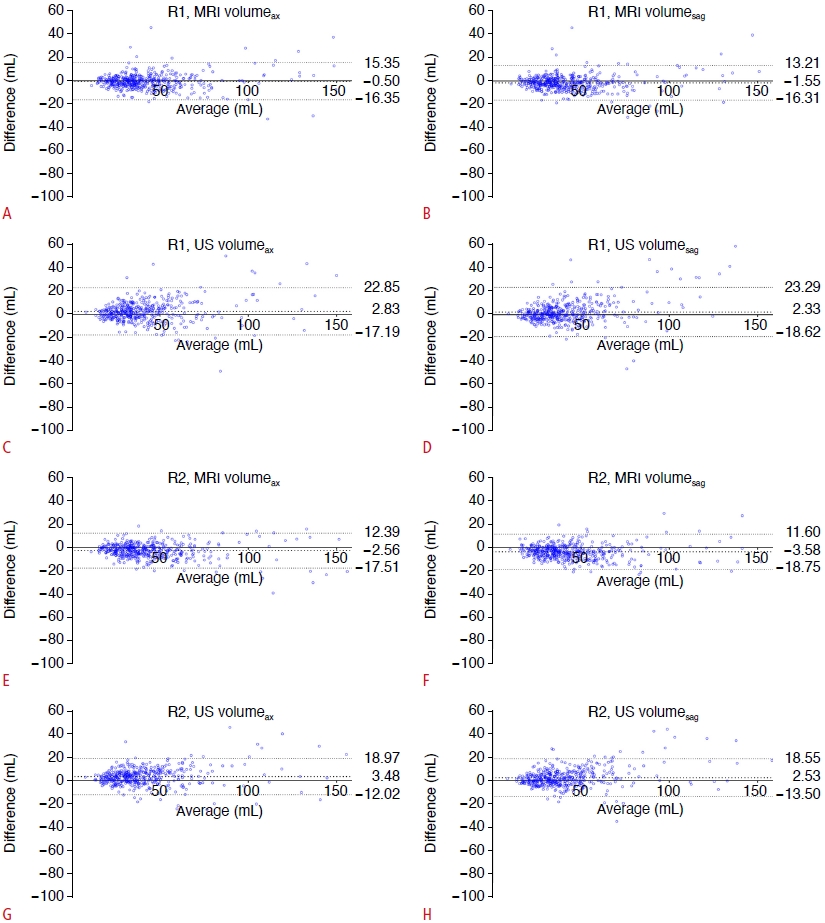
The median segmented prostate volume was 37.00 mL. Despite the significant differences between the volume estimates and segmented volume, all volume estimates showed excellent agreement with the gold standard (ICC >0.9) (Table 5). The median MRI volume was larger than the segmented volume, and the US volume was smaller than the segmented volume. In Fig. 3, the volume estimates on US showed a slightly wider 95% limit of agreement than MRI.
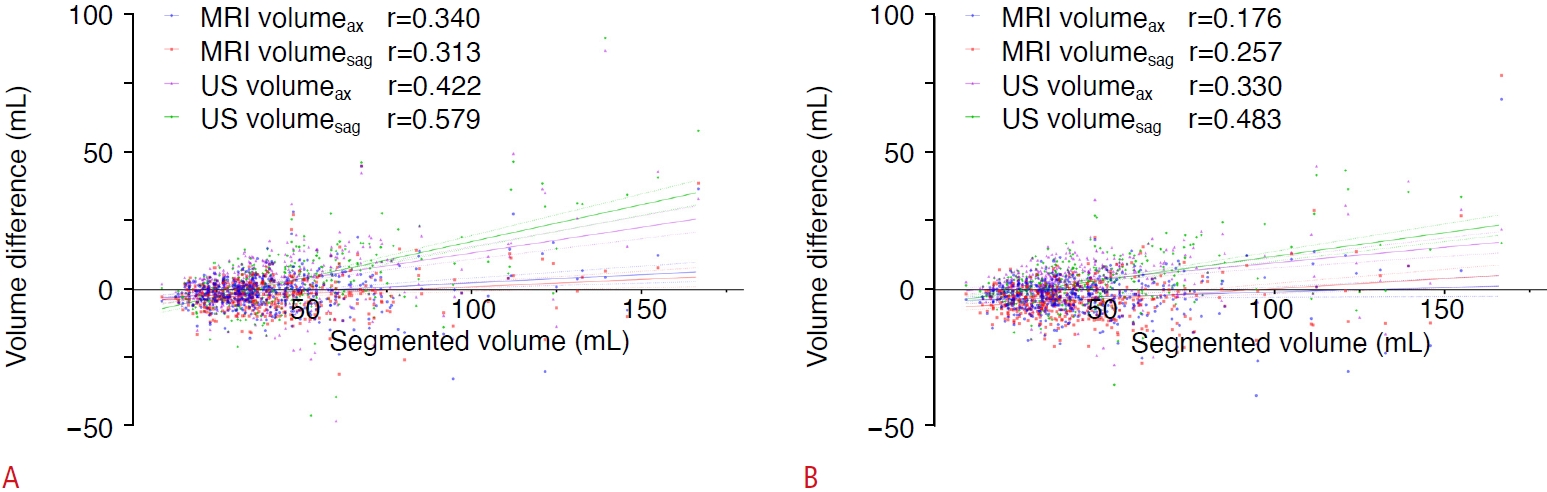
The volume difference between the volume estimates and segmented volume increased as the prostate gland volume increased in all four types of estimates (P<0.001), with greater difference on US than on MRI in patients with larger prostate glands (Fig. 4).
Discussion
This study compared the prostate volume estimates using two different AP diameters measured on axial and sagittal images by US and MRI in a large number of patients (n=456). The four types of volume estimates from the ellipsoid formula on US and MRI were compared to the gold standard (segmented volume) that was extracted from the segmented masks of the entire prostate gland on MRI. On both US and MRI, the difference between volumeax and volumesag was small in absolute values but statistically significant. Even though all volume estimates showed excellent correlations with the gold standard prostate volume, the volume estimates were significantly different from the gold standard. The results of this study suggest that the prostate AP diameter should be consistently measured on either the axial or sagittal plane and on either US or MRI to generate consistent volume estimations.
On MRI, measuring the AP diameter on axial images and on sagittal images follows the PIRADS version 2.0 and version 2.1 recommendations, respectively. PIRADS version 2.1 changed the plane used to measure the AP diameter from axial to sagittal, because axial MRI images are not necessarily parallel to the short axis of the prostate gland. A previous study showed that using the ellipsoid formula for the AP diameter on axial images (PIRADS version 2.0 recommendation) yielded the most accurate volume estimates [18]. The present study also showed similar results: MRI volumeax showed a more similar median value to the segmented volume than MRI volumesag. Therefore, the ellipsoid formula using the AP diameter on axial images may also lead to sufficiently accurate estimations of the prostate gland volume.
We applied the same concept of volume measurement as with MRI to US and obtained different results. The median US volumeax was much smaller than the segmented volume, compared with the US volumesag, even though the volume estimates on US showed excellent agreement with the segmented volume. Based on the results of the present study, the AP diameters on sagittal US images and those on axial MRI images are preferable to estimate prostate gland volume, and these results are similar to the findings of a previous study [9]. However, there is another study that showed different results: the US volumeax was not significantly different from the US volumesag, but the US volumeax was better correlated with the volume measured after prostatectomy [25].
Like previous studies, the MRI-based ellipsoid formula overestimated, and the US-based method underestimated prostate gland volume in the current study [26,27]. The AP diameter of the prostate may decrease due to compression by the ultrasound probe during the examination, and the volume may be underestimated [28]. PSAD calculated with a US-based volume estimate likely overstates the risk of prostate cancer compared with that calculated using an MRI-based volume estimate. Additionally, the volume difference (segmented volume-volume estimate) was significantly correlated with prostate gland volume. The four kinds of volume estimates all showed greater differences in patients with large prostate gland volumes, especially on US. These results mean that the imaging tended to underestimate the larger prostate glands, as a previous study showed [26]. The correlation coefficient between the volume difference and segmented volume was higher for US than for MRI. These results imply more accurate volume estimation on MRI than US, similar to that reported in a systematic review [26]. These results may be due to the relatively small field of view in US, which may not include the entire prostate gland if it has a large volume.
The inter-method agreement between volumeax and volumesag was excellent (ICC >0.9) for both MRI and US by both radiologists. However, the 95% limits of agreement in Bland-Altman plots between the two methods were wider for US than for MRI. The differences between the two methods tended to increase as the prostate gland volume increased. In some patients with large prostate glands (>100 mL), the difference between the volume estimates using the two methods was approximately 20 mL, which was considerable. Therefore, consistently using axial or sagittal images to measure the AP diameter seems important in daily practice to eliminate the inaccuracy in volume estimation by the two methods.
The AP diameters on axial and sagittal images between the two radiologists were similar for MRI but significantly different for US. Interestingly, significant differences were observed in the transverse and longitudinal diameters between the two radiologists on both US and MRI. Nevertheless, all measurements for both US and MRI showed excellent inter-reader agreement (ICC >0.9), and no systematic bias was found on Bland-Altman plots. Therefore, the selection of either axial or sagittal images for measuring AP diameter appears to not be very important in terms of maintaining high inter-reader agreement between US and MRI. Instead, more precise guidelines to measure transverse and longitudinal diameters may be necessary.
Some limitations of this study should be noted. First, this study used transrectal US images that had already been obtained during clinical practice. To minimize the variability in image quality that may be caused by physician experience, only patients who underwent prostate US performed by board-certified radiologists were included. Second, the gold standard of prostate volume was extracted from whole-gland segmentation on MRI rather than a volume measurement of pathologic specimens. However, the ellipsoid formula was unable to reflect the real shape of the prostate gland, even for prostatectomy specimens [27]. Estimating the prostate gland volume by converting the prostate weight using tissue density also has the potential to be inaccurate [9]. Third, extensive prostate cancer was included in the prostate segmentation. Given that cancer is not differentiated from the normal prostate gland when measuring prostate gland volume in routine practice, including prostate cancer in the prostate gland appeared to be a more practical way to measure prostate gland volume.
In conclusion, volumeax and volumesag showed excellent intermethod agreement and excellent agreement with the gold standard on both US and MRI. However, the prostate volume was overestimated on MRI and underestimated on US.
 Download Citation
 PDF Links
 PubReader
 ePub Link
 Full text via DOI


