

 Print
Print facebook
 twitter
 Linkedin
 google+

Introduction
Prostate cancer (PCa) is clinically suspected based on the results of a digital rectal examination and/or elevated serum prostate-specific antigen (PSA) levels. The standard for the pathologic diagnosis in men with clinical suspicion of PCa is grayscale transrectal ultrasound (TRUS)–guided 10-12 core systematic biopsy. However, the diagnostic pathway using grayscale TRUS has limited sensitivity (17%-57%) and specificity (40%-63%) for PCa detection [1]. It is difficult to detect prostate lesions accurately, as approximately 58% of PCa cases are multifocal, progress along the prostatic capsule, and may not be seen as well-defined nodules, unlike other malignant tumors [2]. Furthermore, suspicious hypoechoic areas demonstrate PCa in only 9%-53% of cases [3,4].
PCa has higher cell and vessel density than benign prostatic tissues, and accordingly, it can be stiffer [5,6]. Strain elastography has demonstrated the potential for improving PCa detection, with pooled sensitivity and specificity of 67% and 71%, respectively [7]. However, this technique has several disadvantages in daily clinical practice, including manual compression, reader dependency, and the lack of quantitative data. To overcome these limitations, shear wave elastography (SWE) has been proposed as a noninvasive tool that can provide quantitative stiffness information for tissues in real time. Several studies have reported the potential ability of SWE to detect PCa, with sensitivity of 43%-96% and specificity of 69%-96% [8-12].
Of the several SWE techniques, two-dimensional SWE (2D-SWE) is the newest tool; it uses acoustic radiation force, and several commercially available systems have been developed [13]. More recently, a new 2D-SWE device was developed: S-Shearwave Imaging from Samsung Medison (Seoul, Korea), which generates shear waves using multiple acoustic radiation forces. This 2D-SWE ultrasonography (US) system equipped with several advanced technologies can offer a user-friendly system, including a touch-screen monitor, region of interest (ROI) placement by a trackball, and easy control of the color-mapped elasticity range by pushing a button on the screen. Moreover, the reliable measurement index (RMI) enables reliable quantitative measurements of 2D-SWE for tissue stiffness by filtering out unreliable results. Accordingly, the operator can acquire highly reliable tissue stiffness values more intuitively by comparing the stiffness and the RMI maps on the same screen [14,15]. The purpose of this study was to investigate whether 2D-SWE was useful for predicting PCa.
Materials and Methods
Compliance with Ethical Standards
Institutional review board (IRB) of Samsung Medical Center approval was obtained for this prospective study, and all patients provided written informed consent (IRB No. 2019-08-145).
Study Population
From September 2020 to April 2021, 40 patients with suspected PCa referred for magnetic resonance imaging (MRI)–TRUS fusion-guided biopsy from the urology department to the authors’ department were enrolled in this study. The inclusion criteria were as follows: (1) age ≥40 years and ≤80 years; (2) PSA levels ≥2.5 ng/mL with or without a target lesion on prebiopsy multiparametric MRI; and (3) performing 2D-SWE, followed by a standard systematic 12-core biopsy with and without targeted biopsy. The exclusion criteria were as follows: (1) age <40 years or >80 years, (2) previous radiotherapy or chemotherapy in the pelvis, (3) rectal stenosis due to previous surgery, and (4) refusal to participate in this study. Two patients withdrew their consent. Finally, 38 consecutive patients who met the eligibility criteria were enrolled. The mean age was 60.4 years (range, 40 to 80 years).
TRUS and 2D-SWE
TRUS was performed using an ultrasound system (RS85, Samsung Medison, Seoul, Korea) equipped with an EA2-11AR transrectal probe by one radiologist (C.K.K.) with >10 years’ experience in genitourinary US examinations. Grayscale US and 2D-SWE imaging were performed. After volume measurement and routine imaging, the prostate was divided into 12 sectors for both SWE imaging and MRI-TRUS fusion-guided systematic biopsy, with and without a targeted biopsy.
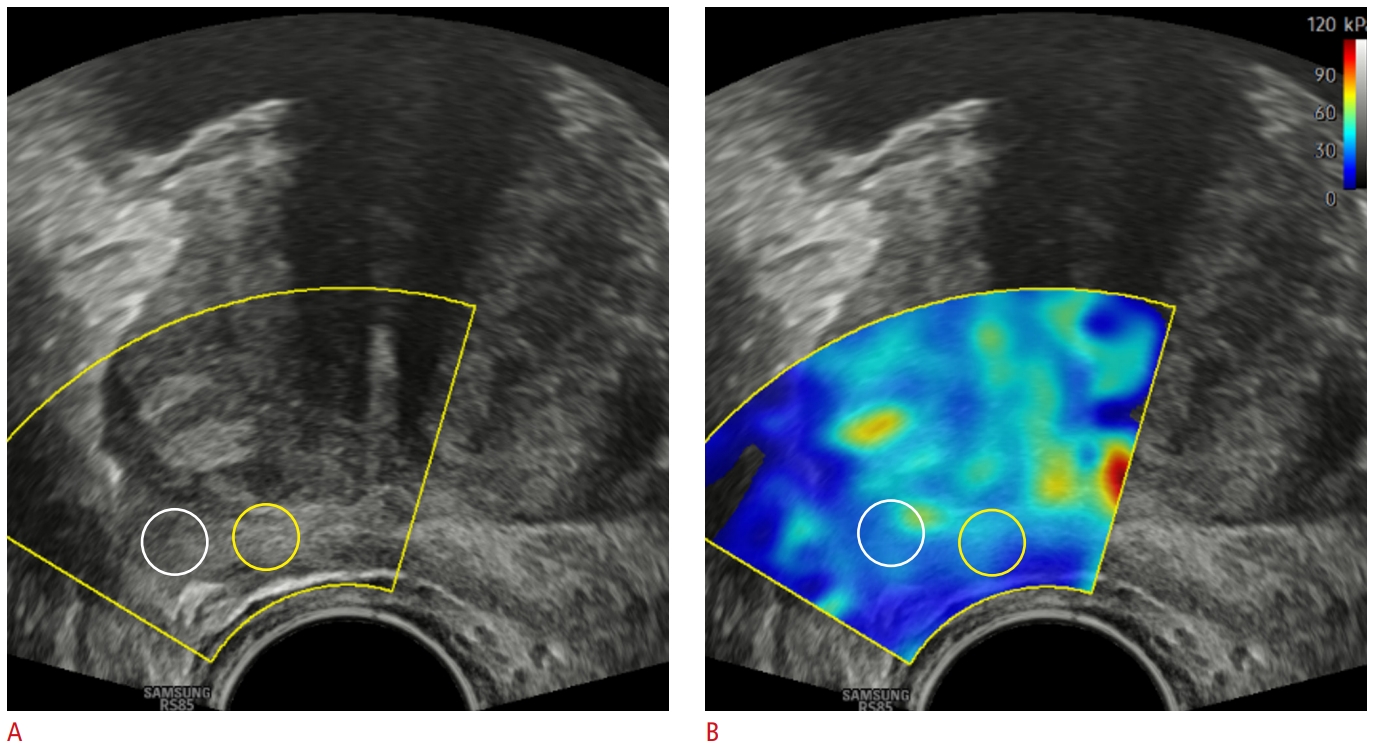
S-Shearwave Imaging, a recently developed 2D-SWE system, generates an image that includes both stiffness and RMI maps. SWE imaging was performed by generating a shear wave using a sonographic push pulse; the tissue stiffness is then expressed as a color-coded map of Young’s modulus (E, kPa), which is the ratio of stress placed on a material to the deformation caused by stress, overlaid on grayscale imaging. The RMI map presents relative elasticity values, which are shown on a color scale that ranges to yellow, but turns to red or black if the value is not reliable. It is calculated using the weighted sum of the residual of the weight equation and magnitude of the shear wave [14]. According to the World Federation for Ultrasound in Medicine and Biology guidelines [2], SWE was performed in all patients. A 2D-SWE map with a sample box overlaid on a grayscale US image was placed in the base, mid-gland, and apex of the right and left lobes on the axial plane. To ensure stable acquisition of the SWE data, the least possible pressure was applied to the prostate while maintaining contact with the probe for 2-4 seconds. For each of the 12 sectors, one circular ROI with a diameter of 3-5 mm was placed along the estimated path of the systematic standard biopsy to calculate the Young’s modulus (Fig. 1). To minimize the mismatch between the biopsy path and ROI placement on SWE imaging, several landmarks, such as cysts, benign prostatic hyperplasia nodules, or calcifications were used. In addition, the lesion echogenicity on grayscale US and vascularity on color Doppler US and stiffness on SWE imaging were evaluated for target lesions seen on prebiopsy multiparametric MRI. An attempt was made to find focal lesions on grayscale US or SWE imaging. To minimize the possible measurement variability in SWE, the stiffness was measured for ROIs with an RMI ≥0.5, and measurements were performed twice, with the corresponding mean value used to represent the stiffness of each ROI. Three quantitative SWE parameters were generated: the maximum Young’s modulus of stiffness (Emax), the mean Young’s modulus of stiffness (Emean), and the minimum Young’s modulus of stiffness (Emin).
For SWE measurements, interobserver reliability and variability were evaluated in 21 patients by another radiologist (S.Y.P.) with >5 years’ experience in genitourinary US examinations immediately after the SWE measurements were made by the first radiologist in the same session. SWE measurements were performed in the 12 sectors corresponding to the estimated path for a 12-core systematic biopsy using the same method as a radiologist.
Prebiopsy MRI and MRI-TRUS Fusion Biopsy
All patients underwent prebiopsy prostate MRI using a 3-T MRI scanner (Achieva TX, Philips Healthcare, Best, The Netherlands) equipped with a phased-array coil. The routine prostate MRI protocols included T2-weighted, T1-weighted, diffusion-weighted, and dynamic contrast-enhanced MR images according to the Prostate Imaging-Reporting and Data System (PI-RADS) version 2 guidelines [16]. The MRI scans were interpreted using the 5-point scale of PI-RADS version 2.1 [17]. The radiologists were not blinded to the clinical findings because the patients underwent prebiopsy MRI to determine whether MRI-guided target biopsy would be performed.
Immediately after the TRUS and SWE examinations were completed, all MRI-TRUS fusion-guided targeted biopsies were performed by the radiologist (C.K.K.) using an ultrasound device (UroNav, Philips Healthcare) in the same session with an end-firing transrectal transducer. This UroNav platform fuses the MRI with the TRUS data through rigid registration in real time. For target lesions on prebiopsy MRI or focal lesions on SWE, 2-4 biopsy cores were obtained. If the lesion was detected on only MRI but was invisible on TRUS, the target biopsy was performed in the corresponding site on MRI-TRUS fusion imaging. From the prostate base to the apex bilaterally, a concurrent systematic 12-core biopsy was performed in 12 sectors divided using prebiopsy SWE imaging. To minimize the potential misregistration between two different US machines used for SWE imaging and biopsy, the same radiologist that performed prebiopsy SWE imaging performed MRI-TRUS fusion-guided targeted and systematic biopsy based on landmarks in the prostate, such as calcifications, benign prostatic nodules, the urethra, or the capsule.
Histopathological Findings
Core biopsy specimens were evaluated independently by a pathologist who was blinded to the quantitative SWE. If a biopsy specimen was considered as PCa, the International Society of Urological Pathology (ISUP) grade was recorded. Clinically significant cancer (CSC) was defined as an ISUP grade ≥2 [18].
Statistical Analysis
All statistical analyses were performed using commercial software packages (IBM SPSS Statistics for Windows, version 26.0, IBM Corp., Armonk, NY, USA; MedCalc, version 13.0, MedCalc Software, Mariakerke, Belgium).
A statistical power analysis established prospectively that a sample size of 40 patients would provide at least 90% power to detect an expected area under the receiver operating characteristics (ROC) curve (AUROC) value of 0.80 to identify PCa assuming a one-sided α of 5% (one-sided ROC curve analysis) [2,19].
According to the biopsy results, patients were divided into two groups: patients with PCa and without PCa. The clinical parameters were compared between these two groups using the Student t-test, Mann-Whitney U test, or Fisher exact test.
The diagnostic performance of the clinical and SWE parameters for predicting all PCa and CSC per patient and per region was evaluated using ROC curve analysis, and pairwise comparisons of the AUROCs were also performed between clinical and SWE parameters. The optimal cutoff values of the parameters were determined using the greatest Youden index. The sensitivity, specificity, and AUROC values were derived for the thresholds. In the patient-based analysis, the index PCa was defined as the PCa with the highest ISUP grade.
For SWE measurements, interobserver reliability and variability in the right lobe, left lobe, and both lobes were evaluated using intraclass correlation coefficients (ICCs) and Bland-Altman plots, respectively. The reliability according to the ICC value was considered to be poor (0.00-0.20), fair (0.21-0.40), moderate (0.41-0.60), good (0.61-0.80), or excellent (0.81-1.00). A two-sided P-value of <0.05 was considered statistically significant.
The associations between the SWE parameters of PCa and Gleason scores or PI-RADS scores were determined using Spearman rank correlation analysis.
Results
Baseline Characteristics
Table 1 presents the patients’ characteristics. The median numbers of target biopsies and combined target and systematic biopsy cores were 2 and 14, respectively.
Of the 38 patients, 17 (44.7%) had PCa, and the remaining 21 (55.3%) were cancer-negative. Among the 17 patients with PCa, the median ISUP grade was 2, with grade 1 in four patients, grade 2 in six patients, grade 3 in four patients, grade 4 in two patients, and grade 5 in one patient. Patients with PCa had a significantly lower prostate volume than those without PCa (P=0.043). No significant differences in age, PSA level, PSA density, the number of target biopsy cores, or the number of combined target and systematic biopsy cores were observed (all P>0.05).
In total, 32 target lesions in 32 patients were seen on prebiopsy MRI or SWE imaging. Regarding lesion location, 20 were in the peripheral zone (PZ), 11 were in the transition zone, and one was in the central zone. The mean size of the target PCa lesions was significantly higher than that of the target lesions that were not PCa (P=0.039).
Comparisons of SWE Parameters between PCa and Benign Tissue
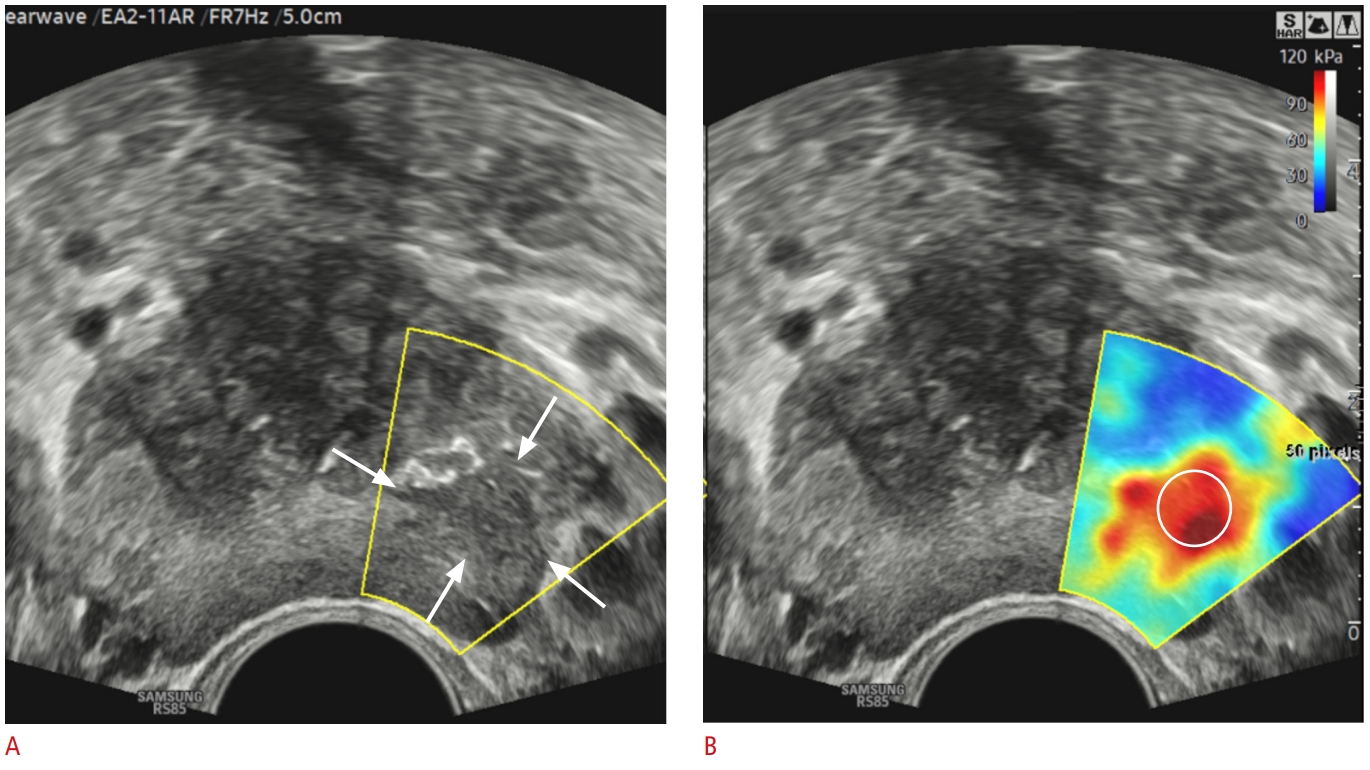
In 38 patients, the Emax, Emean, and Emin values of PCa were significantly higher than those of benign tissues (all P<0.05) (Table 1, Fig. 2).
The results of the quantitative SWE parameters in PCa and benign tissue in the region-based analysis are shown in Table 2. Of the 488 regions, 78 (16.0%) had PCa and the remaining 410 (84.0%) showed no PCa. The ISUP distributions of the 78 PCa regions were as follows: grade 1, n=42; grade 2, n=21; grade 3, n=10; grade 4, n=4; and grade 5, n=1. The Emax, Emean, and Emin values of the regions with PCa were significantly higher than those of the regions without PCa (all P<0.05). Furthermore, all SWE parameters of regions with CSC were significantly higher than those of regions without CSC (all P<0.05).
Diagnostic Performance of Parameters for Predicting PCa
Table 3 presents the diagnostic performance of several parameters for predicting all PCa and CSC in the patient-based ROC curve analysis. For predicting all PCa, Emean showed the highest AUROC (0.840), followed by Emin (0.832), Emax (0.804), and PSA density (0.717), and there were no significant differences between those parameters (all P>0.05). With an optimal cutoff value of 41.3 kPa, the sensitivity and specificity of Emean were 70.6% and 100%, respectively. For predicting CSC, Emax showed the highest AUROC (0.865), followed by Emean (0.855), Emin (0.828), and PSA density (0.749), and there were significant differences between them (all P>0.05). With an optimal cutoff value of 52.4 kPa, the sensitivity and specificity of Emax were 84.6% and 92.0%, respectively.
Table 4 presents the diagnostic performance of the SWE parameters in predicting all PCa and CSC in the region-based ROC curve analysis. Of the 78 regions with PCa, 36 had CSC and the remaining 42 had no CSC. For predicting all PCa and CSC, the AUROCs of Emean were 0.713 and 0.776, respectively, followed by Emax and Emin. For predicting all PCa and CSC, significant differences were found between Emean and Emin (P=0.029 and P=0.041, respectively), but no significant differences were noted between Emean and Emax or between Emax and Emin (all P>0.05). With optimal cutoff values of 41.1 kPa and 47 kPa of Emean, the sensitivity and specificity were 43.6% and 87.6% for predicting all PCa, and 50.0% and 92.4% for predicting CSC, respectively.
Interobserver Reliability and Variability
Regarding interobserver reliability, the ICCs of the Emax, Emean, and Emin values in the right PZ were 0.660 (95% confidence interval [CI], 0.328 to 0.846), 0.599 (95% CI, 0.236 to 0.815), and 0.769 (95% CI, 0.512 to 0.899), respectively; those in the left PZ were 0.528 (95% CI, 0.136 to 0.777), 0.591 (95% CI, 0.225 to 0.811), and 0.595 (95% CI, 0.229 to 0.813), respectively; and those in both PZs were 0.542 (95% CI, 0.154 to 0.785), 0.640 (95% CI, 0.297 to 0.836), and 0.687 (95% CI, 0.372 to 0.860), respectively.
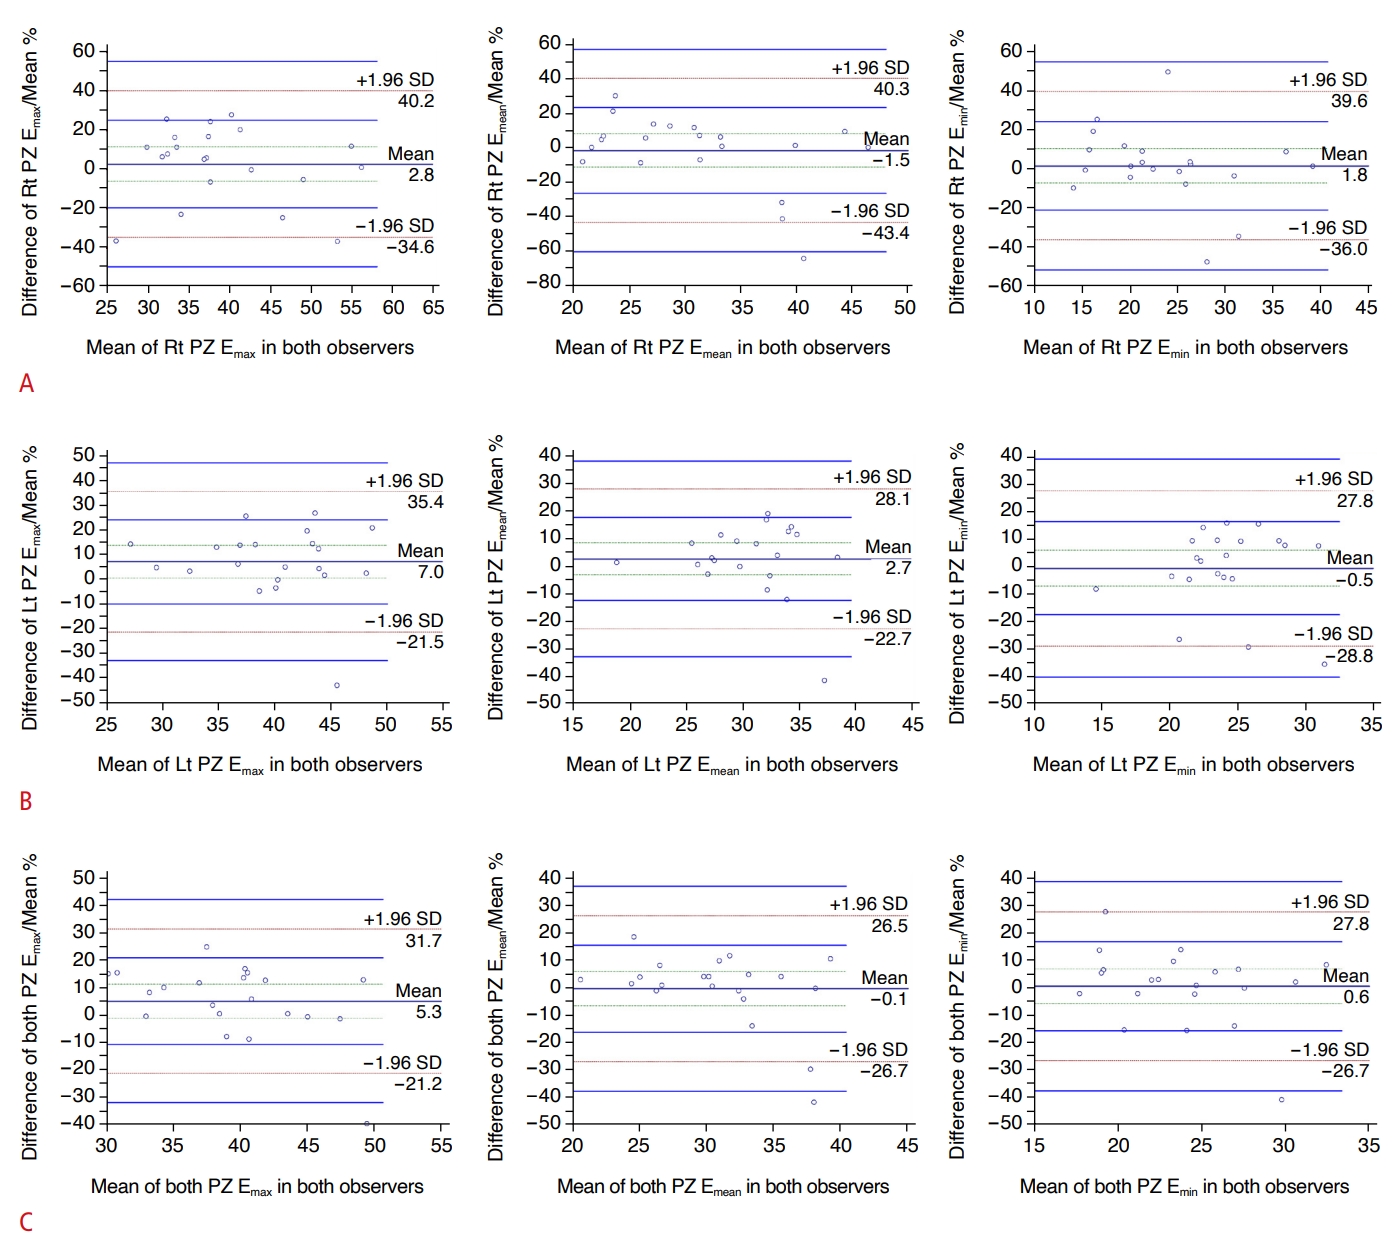
For interobserver variability, Bland-Altman plots demonstrated that the mean differences in Emax, Emean, and Emin in the right PZ were 2.8%, 1.5%, and 1.8%, respectively; those in the left PZ were 7.0%, 2.7%, and 0.5%, respectively; and those in both PZs were 5.3%, 0.1%, and 0.6%, respectively (Fig. 3).
Associations between SWE Parameters and ISUP or PI-RADS
The ISUP grade showed weak associations with Emax (Spearman coefficient=0.391, P=0.004), Emean (Spearman coefficient=0.324, P<0.001), and Emin (Spearman coefficient=0.259, P=0.022).
The PI-RADS score was moderately correlated with Emax (Spearman coefficient=0.602, P<0.001), Emean (Spearman coefficient=0.587, P<0.001), and Emin (Spearman coefficient=0.562, P<0.001).
Discussion
The results of this study demonstrated that the values of all quantitative parameters derived from a newly developed 2D-SWE system were significantly higher than those of benign prostate tissues in patient-based and region-based analyses. In the ROC curve analysis, SWE parameters revealed good diagnostic performance for predicting CSC in patient-based and region-based analyses. Furthermore, the interobserver reliability of the SWE parameter measurements was moderate to good. The interobserver variability in Bland-Altman plots was excellent, with a mean percentage difference of ≤7%. These findings indicate that 2D-SWE imaging is a reproducible tool that might offer useful information for differentiating between PCa and benign prostate tissues and for predicting CSC.
Many studies have reported that SWE is useful for differentiating between PCa and benign prostate tissue [8,11,12,20-23]. The Emean values of PCa and benign tissue were 55-134 kPa and 21-75 kPa, respectively. In the present study, the Emean values of PCa versus benign tissue in the patient-based and region-based analysis were 69.0 and 47.1 kPa versus 31.0 and 28.8 kPa, respectively; these values were significantly different, as has also been reported previously [8,11,12,20-23]. These findings might be explained by the increased cellularity, increased microvascularity, loss of glandular architecture, reduction in acinar area, and increased collagen deposition in the stroma surrounding the cancer, leading to increased stiffness of the cancerous tissue in the prostate [24].
Many studies have reported that with a cutoff Emean value of 35-70 kPa, SWE can differentiate PCa from benign tissue [8,11,12,20,21]. Some studies demonstrated that SWE had sensitivity of 90%-96.2% and specificity of 85%-96.2% [8,21,25], while other studies showed sensitivity of 43%-80.9% and specificity of 69.1%-80.8% for predicting PCa [11,12]. In the present study, the sensitivity and specificity of the Emean value were 70.6% and 100%, respectively, with a cutoff value of 41.3 kPa in the patient-based analysis, and those of Emean were 43.6% and 87.6%, respectively, with a cutoff value of 41.1 kPa in the region-based analysis. These cutoff values on SWE are very similar to those reported by Fu et al. [26] and Boehm et al. [12,22]. Using these cutoff values, a recent meta-analysis demonstrated that the pooled sensitivity and specificity of Emean for predicting PCa were 84.4% and 86.0%, respectively [27]. These discrepancies among studies might be explained by differences among the study populations in PSA levels, ISUP grade, or lesion size. Another potential reason could be differences in the pressure applied to the prostate by the probe among the studies, although the least amount of pressure to the prostate was likely applied.
Several quantitative parameters can be derived from 2D-SWE imaging. Several recent studies have reported the usefulness of quantitative SWE parameters for evaluating PCa [23,28]. Ji et al. [23] demonstrated that the AUROCs of the Emax, Emean, and Emin values for differentiating malignant and benign lesions were 0.855, 0.842, and 0.588, respectively. In a study by Dai et al. [28], Emax, Emean, and Emin were used to differentiate indolent cancer (ISUP grade 1-2) from aggressive cancer (ISUP grade ≥3). The AUROCs of the Emax, Emean, and Emin values for differentiating indolent and aggressive cancers were 0.816, 0.776, and 0.739, respectively. In these results using 2D-SWE imaging, the AUROCs of the Emax, Emean, and Emin values in the patient-based and region-based analyses were evaluated for predicting CSC (ISUP grade ≥2), and the results were in line with those of previous studies [23,28]. Although these results did not demonstrate increased performance for predicting PCa compared with the previous studies [23,28], the authors believe that this newly developed 2D-SWE US system can offer several advantages with advanced user-friendly system in daily clinical practice, such as RMI image, a touch-screen monitor, and easy control of the color-mapped elasticity range.
Assessing intraobserver or interobserver agreement or variability is a prerequisite for using quantitative imaging parameters. Few studies have reported the results for intraobserver or interobserver reliability or variability on prostate SWE [29]. A recent study reported that the overall intraobserver reliability was excellent [29]. In the present study, the interobserver reliability for all SWE parameters was moderate to good. Furthermore, all interobserver variabilities on Bland-Altman plots were excellent. These findings suggest that prostate SWE may become a more widely accepted method that enables consistent image generation and interpretation.
In this study, PI-RADS version 2.1 scoring showed moderate correlations with the SWE parameters. Although the PI-RADS scoring system does not offer quantitative information, it does reflect cancer aggressiveness, with a higher score suggesting that the prostate shows hypointensity on an apparent diffusion coefficient map with marked hyperintensity on diffusion-weighted imaging [30,31]. A recent study reported that PI-RADS version 2 may be used to predict long-term postoperative outcomes in PCa patients [30]. Thus, SWE parameters may be associated with PCa aggressiveness.
This study had several limitations. First, although the study had a prospective design, the study population was small and was potentially subject to selection bias. Second, the reference standard in this study was systematic biopsy findings, which might have increased the false-negative rate of PCa. In addition, the definition of CSC (ISUP grade ≥2) in the patient-based analysis might have resulted in sampling bias for under-categorization or over-categorization. Third, this study used different US machines for prostate biopsies and SWE examinations. This might have led to increased mismatching in the 12 sectors for systematic biopsies and SWE imaging. However, one experienced radiologist with at least 1,200 cases of MRI-TRUS fusion biopsy in the most recent 3 years performed SWE imaging and MRI-TRUS fusion biopsy in the same session to minimize potential mismatching based on landmarks. Furthermore, although both SWE imaging and prostate biopsies were performed using the same US machine, a time interval between them could not be avoided, and mismatching could have occurred, considering the characteristics of TRUS procedures.
In conclusion, 2D-SWE appears to be a reproducible and useful method for the prediction of PCa. A larger study is warranted for further validation.
 Download Citation
 PDF Links
 PubReader
 ePub Link
 Full text via DOI


